

What's behind Cadence Design Systems' latest 3.4% stock pullback?

Cadence Design Systems Inc (CDNS) dropped 3.43% as selling pressure mounted, even as revenue stability from partnership and certification for TSMC's A14 chip processes offered a positive backdrop. The move contradicts the ongoing bullish technical structure, with CDNS trading above all key moving averages.
 344.13
361.41
344.13
361.41
Highlights
- Cadence Design Systems recorded a 24.2% year-over-year revenue increase in the second quarter of 2026, benefiting from its partnership and certification with TSMC for A14 chip processes.
- Certifications for competing companies preserved competitive parity in the market, limiting Cadence Design Systems pricing power.
- Shares of Cadence Design Systems fell 3.43% to $336.28, trading within a $321.45 to $343.52 range as momentum indicators remain mixed.
Revenue jump offsets competitive parity as selling outweighs stable outlook
Cadence Design Systems recorded increased revenue stability following partnership and certification with TSMC for A14 chip production processes. The company reported a 24.2% increase in revenue for the second quarter of 2026. This was accompanied by similar certifications awarded to competing companies, which maintain competitive parity and lessen pricing power, though price action has remained under broader selling pressure.
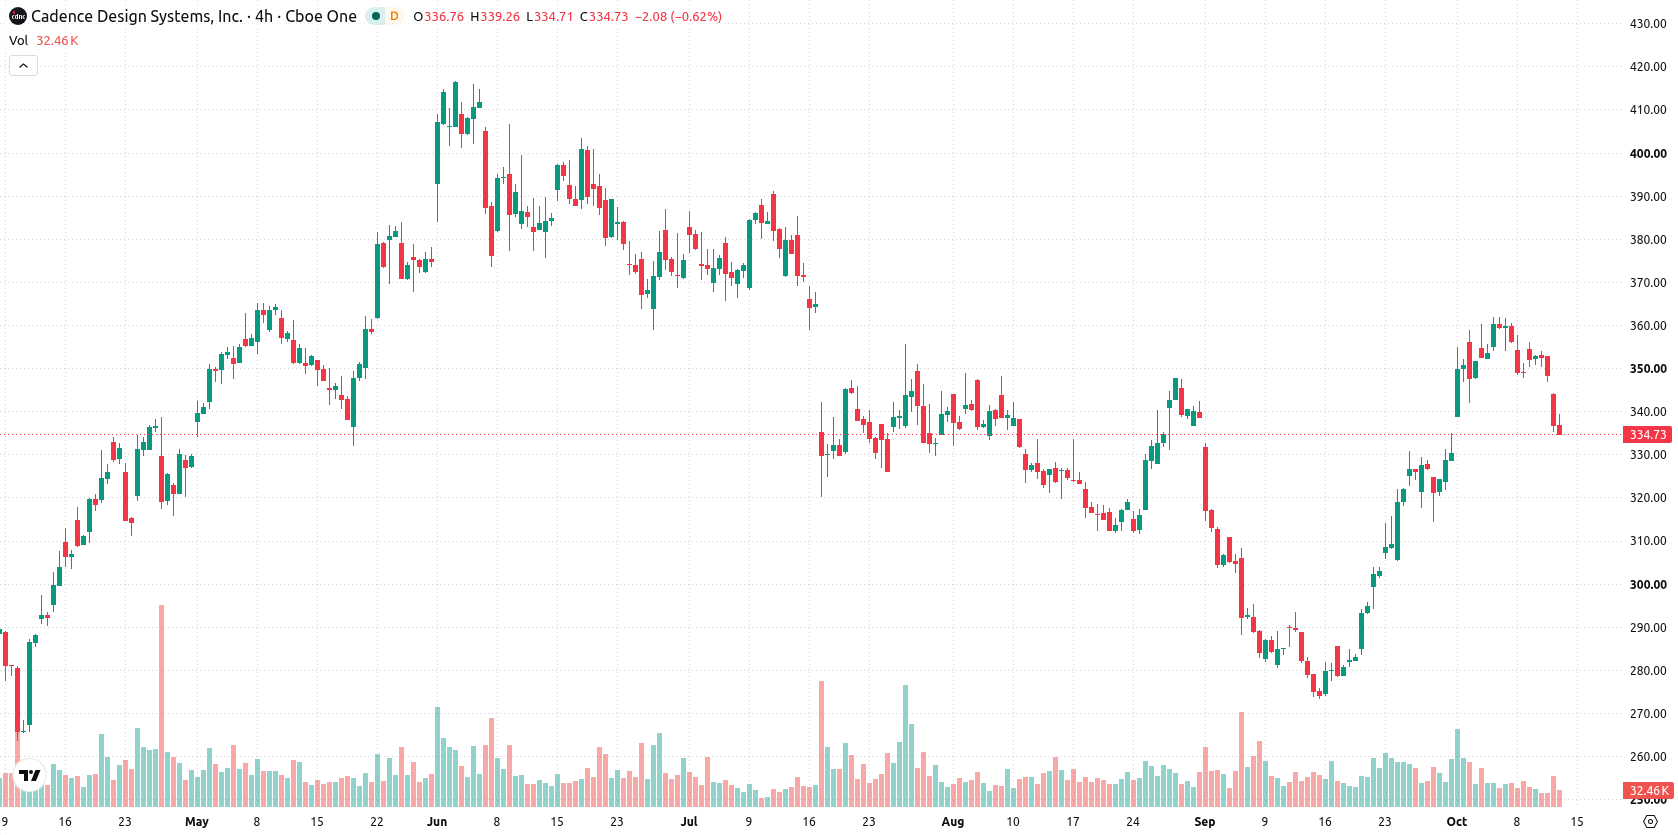
Support holds above averages as mixed momentum signals warn of overbought risk
Cadence Design Systems is currently trading above its 20-, 50-, and 200-day moving averages ($323.77, $320.67, and $326.8), signaling continued short-, mid-, and long-term bullish support. The nearest resistance stands at $343.52 and the closest support is found at $335.29. Momentum signals are mixed: both the Moving Average Convergence Divergence (MACD) and Average Directional Index (ADX) post bullish readings, supported by a 'buy' signal from the Relative Strength Index (RSI) at 62.5 and the Commodity Channel Index (CCI) at 71.43. Bull/Bear Power (BBP) shows buyers in control intraday, yet the 'overbought' condition suggests caution. The daily move reflects a downside gap of about $4.47 (1.28%), with the stock falling $11.94 (3.43%) to $336.28 near session lows. Intraday volatility amplitude is 2.63%. Price weakness and a closing position near lows point to persistent pressure after the open, partially at odds with continued positive momentum signals.
Earlier, analysts noted that Cadence Design Systems was under significant selling pressure amid persistent technical weakness and downside risk. The current technical structure now highlights a possible shift, with mixed momentum signals warranting attention to the $335.29 support level as a catalyst for either renewed downside or a reversal toward higher resistance.





Latest Cadence Design Systems Inc News






-
 Afghanistan
-
 Albania
-
 Algeria
-
 Angola
-
 Argentina
-
 Armenia
-
 Australia
-
 Austria
-
 Azerbaijan
-
 Bahamas
-
 Bahrain
-
 Bangladesh
-
 Belarus
-
 Belgium
-
 Bolivia
-
 Botswana
-
 Brazil
-
 Brunei
-
 Bulgaria
-
 Cambodia
-
 Cameroon
-
 Canada
-
 Chile
Chile
-
 China
China
-
 Colombia
-
 Congo
Congo
-
 Costa Rica
-
 Cote d'Ivoire
-
 Croatia
-
 Cuba
Cuba
-
 Cyprus
-
 Czechia
-
 DR Congo
-
 Denmark
-
 Dominican Republic
-
 Ecuador
-
 Egypt
Egypt
-
 El Salvador
-
 Estonia
-
 Eswatini
-
 Ethiopia
-
 Finland
-
 France
-
 Georgia
-
 Germany
-
 Ghana
Ghana
-
 Greece
-
 Haiti
Haiti
-
 Hong Kong
-
 Hungary
-
 India
India
-
 Indonesia
-
 Iran, Islamic republic
-
 Iraq
Iraq
-
 Ireland
-
 Israel
-
 Italy
Italy
-
 Jamaica
-
 Japan
Japan
-
 Jordan
-
 Kazakhstan
-
 Kenya
Kenya
-
 Korea
Korea
-
 Kuwait
-
 Kyrgyzstan
-
 Laos
Laos
-
 Latvia
-
 Lebanon
-
 Lesotho
-
 Libya
Libya
-
 Lithuania
-
 Luxembourg
-
 Madagascar
-
 Malaysia
-
 Malta
Malta
-
 Mauritius
-
 Mexico
-
 Moldova
-
 Mongolia
-
 Montenegro
-
 Morocco
-
 Mozambique
-
 Myanmar
-
 Namibia
-
 Nepal
Nepal
-
 Netherlands
-
 New Zealand
-
 Nigeria
-
 North Macedonia
-
 Norway
-
 Oman
Oman
-
 Pakistan
-
 Palestine
-
 Panama
-
 Papua New Guinea
-
 Paraguay
-
 Peru
Peru
-
 Philippines
-
 Poland
-
 Portugal
-
 Puerto Rico
-
 Qatar
Qatar
-
 Reunion
-
 Romania
-
 Rwanda
-
 Saudi Arabia
-
 Serbia
-
 Singapore
-
 Slovakia
-
 Slovenia
-
 Somalia
-
 South Africa
-
 Spain
Spain
-
 Sri Lanka
-
 Sweden
-
 Switzerland
-
 Syria
Syria
-
 Taiwan
-
 Tajikistan
-
 Tanzania
-
 Thailand
-
 Trinidad and Tobago
-
 Tunisia
-
 Turkey
-
 UAE
UAE
-
 Uganda
-
 Ukraine
-
 United Kingdom
-
United States
-
 Uruguay
-
 Uzbekistan
-
 Venezuela
-
 Vietnam
-
 Yemen
Yemen
-
 Zambia
-
 Zimbabwe
- Forex
- Crypto












