

What's behind Charter Communications's latest 3.3% stock surge?

Charter Communications, Inc. (CHTR) surged 3.25% on strong short- and medium-term technical momentum, with buying interest driving the stock above key averages. The move is supported by positive momentum signals but restrained by lingering long-term resistance and overbought risk.
 115.87
Highlights
- Charter Communications stock trades above short- and medium-term moving averages but remains below its long-term trend level.
- Momentum indicators give mixed signals, with MACD on strong buy while trend strength and oscillators remain mostly neutral.
- Shares are expected to remain rangebound at $147.2 to $162.43 for the next 5 trading days, with a 63% chance of an upward move.
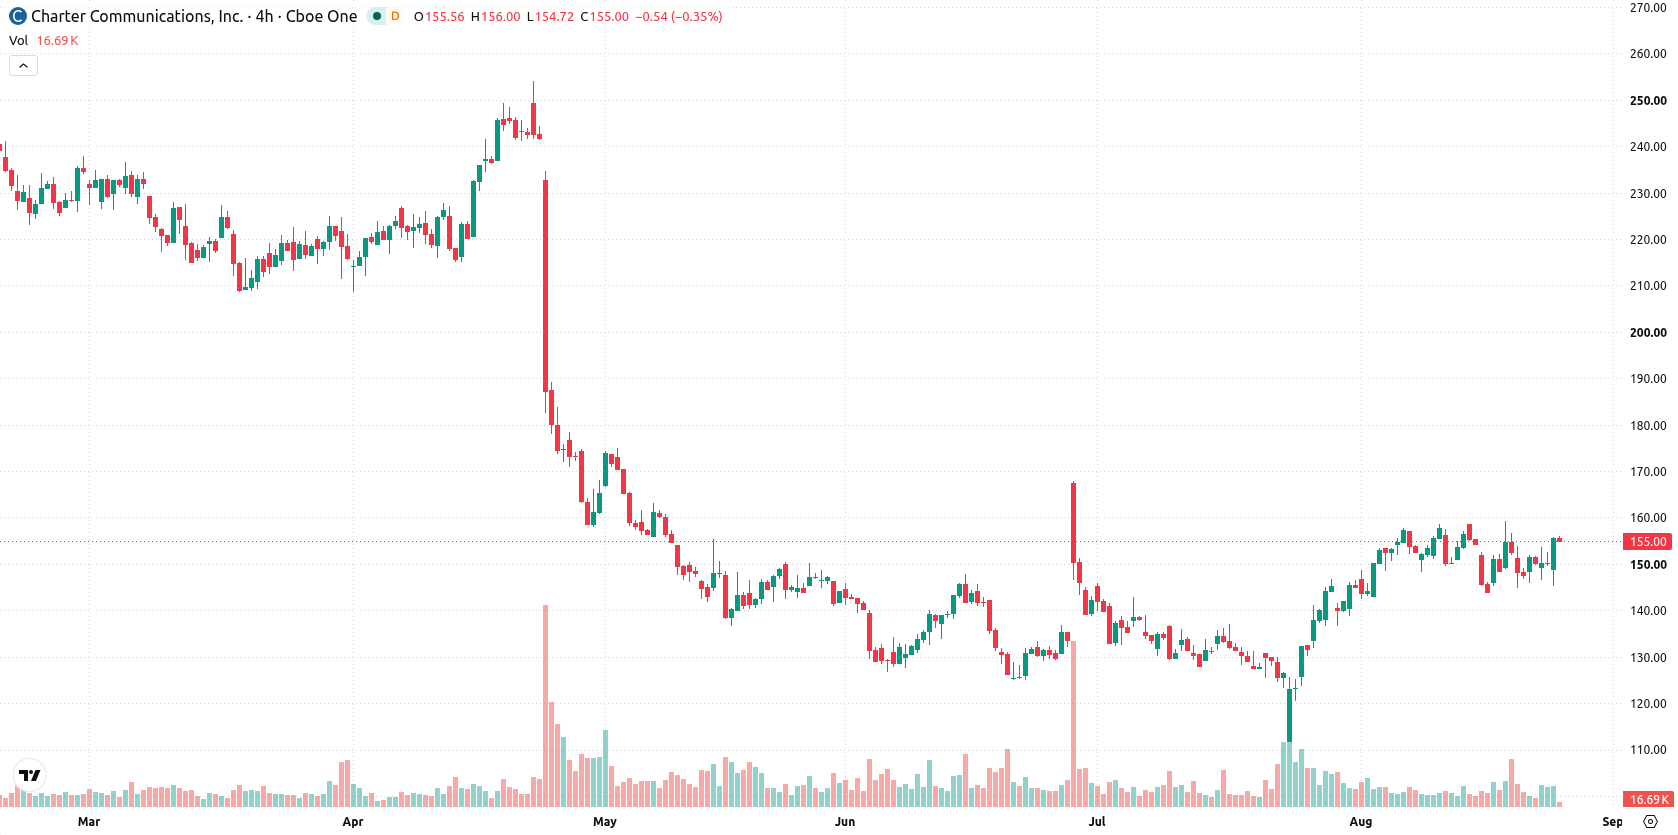
Short-term bullish signals tempered by mixed momentum readings
Charter Communications is trading above the 20-day and 50-day moving averages at $149.88 and $139.99, but remains below the 200-day moving average at $184.83. This signals bullish momentum in the short and medium term, with persistent long-term pressure. The nearest resistance is the week high at $159.29 and intraday support sits at today’s high of $153.85. Momentum indicators show a mixed picture: MACD signals "Strong Buy," suggesting robust upward momentum, but the Average Directional Index (ADX) is neutral, indicating the trend lacks strength. The Relative Strength Index (RSI) is pointed toward buy territory, yet Stochastic RSI and Commodity Channel Index (CCI) are both neutral. Bull/Bear Power (BBP) is positive, indicating buyers dominate, but its "Overbought" warning calls for caution. The Awesome Oscillator is neutral and does not reinforce the upward move. The stock is up $4.89 or 3.25% at $155.19 on a downside gap of about $1.67 (1.11%) and is trading near session highs. Intraday volatility stands at 5.96%, with action showing strength toward the upper end of today’s range. Momentum signals are positive, but a divergence exists between short-term momentum and some neutral oscillators.
Earlier, analysts noted that Charter Communications was exhibiting a short-term bullish bias amid heightened volatility but faced continued long-term resistance. The latest technical signals reinforce this mixed outlook, with momentum favoring further upside if $159.29 is breached, while a drop below $153.85 would suggest renewed downside risk.






Latest Charter Communications News


-
 Afghanistan
-
 Albania
-
 Algeria
-
 Angola
-
 Argentina
-
 Armenia
-
 Australia
-
 Austria
-
 Azerbaijan
-
 Bahamas
-
 Bahrain
-
 Bangladesh
-
 Belarus
-
 Belgium
-
 Bolivia
-
 Botswana
-
 Brazil
-
 Brunei
-
 Bulgaria
-
 Cambodia
-
 Cameroon
-
 Canada
-
 Chile
-
 China
-
 Colombia
-
 Congo
-
 Costa Rica
-
 Cote d'Ivoire
-
 Croatia
-
 Cuba
-
 Cyprus
-
 Czechia
-
 DR Congo
-
 Denmark
-
 Dominican Republic
-
 Ecuador
-
 Egypt
-
 El Salvador
-
 Estonia
-
 Eswatini
-
 Ethiopia
-
 Finland
-
 France
-
 Georgia
-
 Germany
-
 Ghana
-
 Greece
-
 Haiti
-
 Hong Kong
-
 Hungary
-
 India
-
 Indonesia
-
 Iran, Islamic republic
-
 Iraq
-
 Ireland
-
 Israel
-
 Italy
-
 Jamaica
-
 Japan
-
 Jordan
-
 Kazakhstan
-
 Kenya
-
 Korea
-
 Kuwait
-
 Kyrgyzstan
-
 Laos
-
 Latvia
-
 Lebanon
-
 Lesotho
-
 Libya
-
 Lithuania
-
 Luxembourg
-
 Madagascar
-
 Malaysia
-
 Malta
-
 Mauritius
-
 Mexico
-
 Moldova
-
 Mongolia
-
 Montenegro
-
 Morocco
-
 Mozambique
-
 Myanmar
-
 Namibia
-
 Nepal
-
 Netherlands
-
 New Zealand
-
 Nigeria
-
 North Macedonia
-
 Norway
-
 Oman
-
 Pakistan
-
 Palestine
-
 Panama
-
 Papua New Guinea
-
 Paraguay
-
 Peru
-
 Philippines
-
 Poland
-
 Portugal
-
 Puerto Rico
-
 Qatar
-
 Reunion
-
 Romania
-
 Rwanda
-
 Saudi Arabia
-
 Serbia
-
 Singapore
-
 Slovakia
-
 Slovenia
-
 Somalia
-
 South Africa
-
 Spain
-
 Sri Lanka
-
 Sweden
-
 Switzerland
-
 Syria
-
 Taiwan
-
 Tajikistan
-
 Tanzania
-
 Thailand
-
 Trinidad and Tobago
-
 Tunisia
-
 Turkey
-
 UAE
-
 Uganda
-
 Ukraine
-
 United Kingdom
-
United States
-
 Uruguay
-
 Uzbekistan
-
 Venezuela
-
 Vietnam
-
 Yemen
-
 Zambia
-
 Zimbabwe
- Forex
- Crypto












