

Johnson & Johnson shares weekly forecast: Buyers remain in control as resistance at $273.98 approaches

Shares of Johnson & Johnson (JNJ) are trading near $272 as recovery momentum continues into a new week. The advance has been relatively modest, but buyers retain control — though conditions show early signs of being stretched ahead of the next test of resistance.
 257.46
264.13
Highlights
- Shares of Johnson & Johnson have moved up to $271.92, remaining above key daily moving averages in a bullish structure.
- Momentum is strong but appears stretched as indicators approach or enter overbought territory and volatility stands at 2.47%.
- The stock is expected to consolidate or grind higher in the $268.96 to $284.67 range, with $267.37 as key support and $273.98 as resistance.
Upbeat earnings and institutional buying drive positive sentiment this week
Johnson & Johnson reported record second-quarter 2026 sales of $25.3 billion, representing 6.6% year-over-year revenue growth, according to Yahoo Finance and ad-hoc-news.de. The company also raised its full-year 2026 revenue and earnings guidance while declaring a dividend of $1.34 per share, with the stock set to go ex-dividend on August 25, 2026. Several institutional investors, including Caitong International Asset Management Co. Ltd and Elyxium Wealth LLC, increased positions in JNJ during the quarter, adding to a supportive corporate backdrop this week.
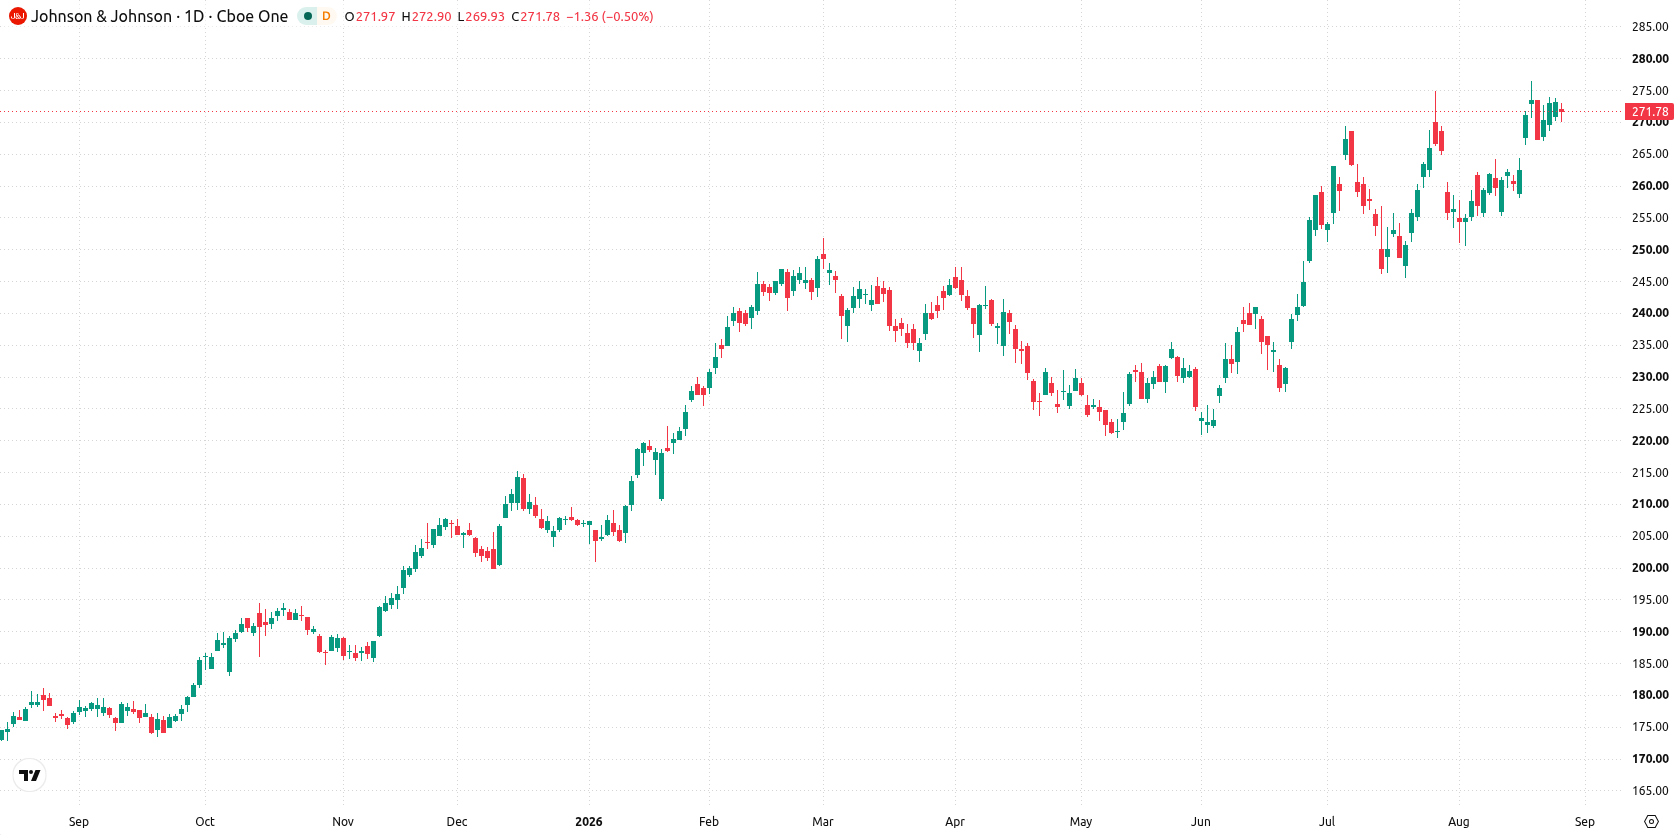
Momentum stretches higher over the week as technicals approach limits
On the daily chart, the structure favors buyers, supported by an emerging move higher that is not yet confirmed. RSI at 64.28 is approaching overbought, and CCI is already in the overbought zone, suggesting momentum is strong but potentially stretched. Volatility over the past week stands at 2.47%. Nearest support sits at $267.37 and resistance is at $273.98, with the Ichimoku Kijun at $260.98 reinforcing a supportive area below.
Bullish breakout risk rises for next week on technical and range signals
Over the next five trading days, the expected range is $268.96 to $284.67, with a very high probability of an increase and a very low probability of a decrease. The base case is continued consolidation or gradual gains within this range. A bullish breakout above $273.98 would open up room toward the upper end near $284.67. A close below $267.37 would challenge the developing uptrend and put the next support levels in focus.
Previously it was reported that Shield Therapeutics achieved higher sales and a reduced loss, signaling continued commercial progress for its core treatment. In comparison, the latest developments for Johnson & Johnson reaffirm positive momentum with upgraded guidance and institutional buying, making the upcoming resistance test near $273.98 a critical level to watch for a potential breakout or pullback.





Latest Johnson & Johnson News





-
 Afghanistan
-
 Albania
-
 Algeria
-
 Angola
-
 Argentina
-
 Armenia
-
 Australia
-
 Austria
-
 Azerbaijan
-
 Bahamas
-
 Bahrain
-
 Bangladesh
-
 Belarus
-
 Belgium
-
 Bolivia
-
 Botswana
-
 Brazil
-
 Brunei
-
 Bulgaria
-
 Cambodia
-
 Cameroon
-
 Canada
-
 Chile
-
 China
-
 Colombia
-
 Congo
-
 Costa Rica
-
 Cote d'Ivoire
-
 Croatia
-
 Cuba
-
 Cyprus
-
 Czechia
-
 DR Congo
-
 Denmark
-
 Dominican Republic
-
 Ecuador
-
 Egypt
-
 El Salvador
-
 Estonia
-
 Eswatini
-
 Ethiopia
-
 Finland
-
 France
-
 Georgia
-
 Germany
-
 Ghana
-
 Greece
-
 Haiti
-
 Hong Kong
-
 Hungary
-
 India
-
 Indonesia
-
 Iran, Islamic republic
-
 Iraq
-
 Ireland
-
 Israel
-
 Italy
-
 Jamaica
-
 Japan
-
 Jordan
-
 Kazakhstan
-
 Kenya
-
 Korea
-
 Kuwait
-
 Kyrgyzstan
-
 Laos
-
 Latvia
-
 Lebanon
-
 Lesotho
-
 Libya
-
 Lithuania
-
 Luxembourg
-
 Madagascar
-
 Malaysia
-
 Malta
-
 Mauritius
-
 Mexico
-
 Moldova
-
 Mongolia
-
 Montenegro
-
 Morocco
-
 Mozambique
-
 Myanmar
-
 Namibia
-
 Nepal
-
 Netherlands
-
 New Zealand
-
 Nigeria
-
 North Macedonia
-
 Norway
-
 Oman
-
 Pakistan
-
 Palestine
-
 Panama
-
 Papua New Guinea
-
 Paraguay
-
 Peru
-
 Philippines
-
 Poland
-
 Portugal
-
 Puerto Rico
-
 Qatar
-
 Reunion
-
 Romania
-
 Rwanda
-
 Saudi Arabia
-
 Serbia
-
 Singapore
-
 Slovakia
-
 Slovenia
-
 Somalia
-
 South Africa
-
 Spain
-
 Sri Lanka
-
 Sweden
-
 Switzerland
-
 Syria
-
 Taiwan
-
 Tajikistan
-
 Tanzania
-
 Thailand
-
 Trinidad and Tobago
-
 Tunisia
-
 Turkey
-
 UAE
-
 Uganda
-
 Ukraine
-
 United Kingdom
-
United States
-
 Uruguay
-
 Uzbekistan
-
 Venezuela
-
 Vietnam
-
 Yemen
-
 Zambia
-
 Zimbabwe
- Forex
- Crypto












