


Technical selling pressure and overbought signals pushed aTyr Pharma Inc (ATYR) down 4.04% as intraday momentum conflicted with a stretched upside. The move is limited by ongoing positive short- and medium-term momentum, with the price trading above the 20-day and 50-day moving averages, even as longer-term structure remains weak below the 200-day average.
 6.40
5.60
Highlights
- aTyr Pharma stock trades above short- and medium-term averages but remains below the longer-term 200-day level, indicating weak broader structure.
- Buy signals from MACD and RSI suggest upward momentum, but overbought readings and a weak trend signal limited strength near term.
- The stock is projected to oscillate between $0.51 and $0.59 over the next five sessions with 73% probability to the upside.
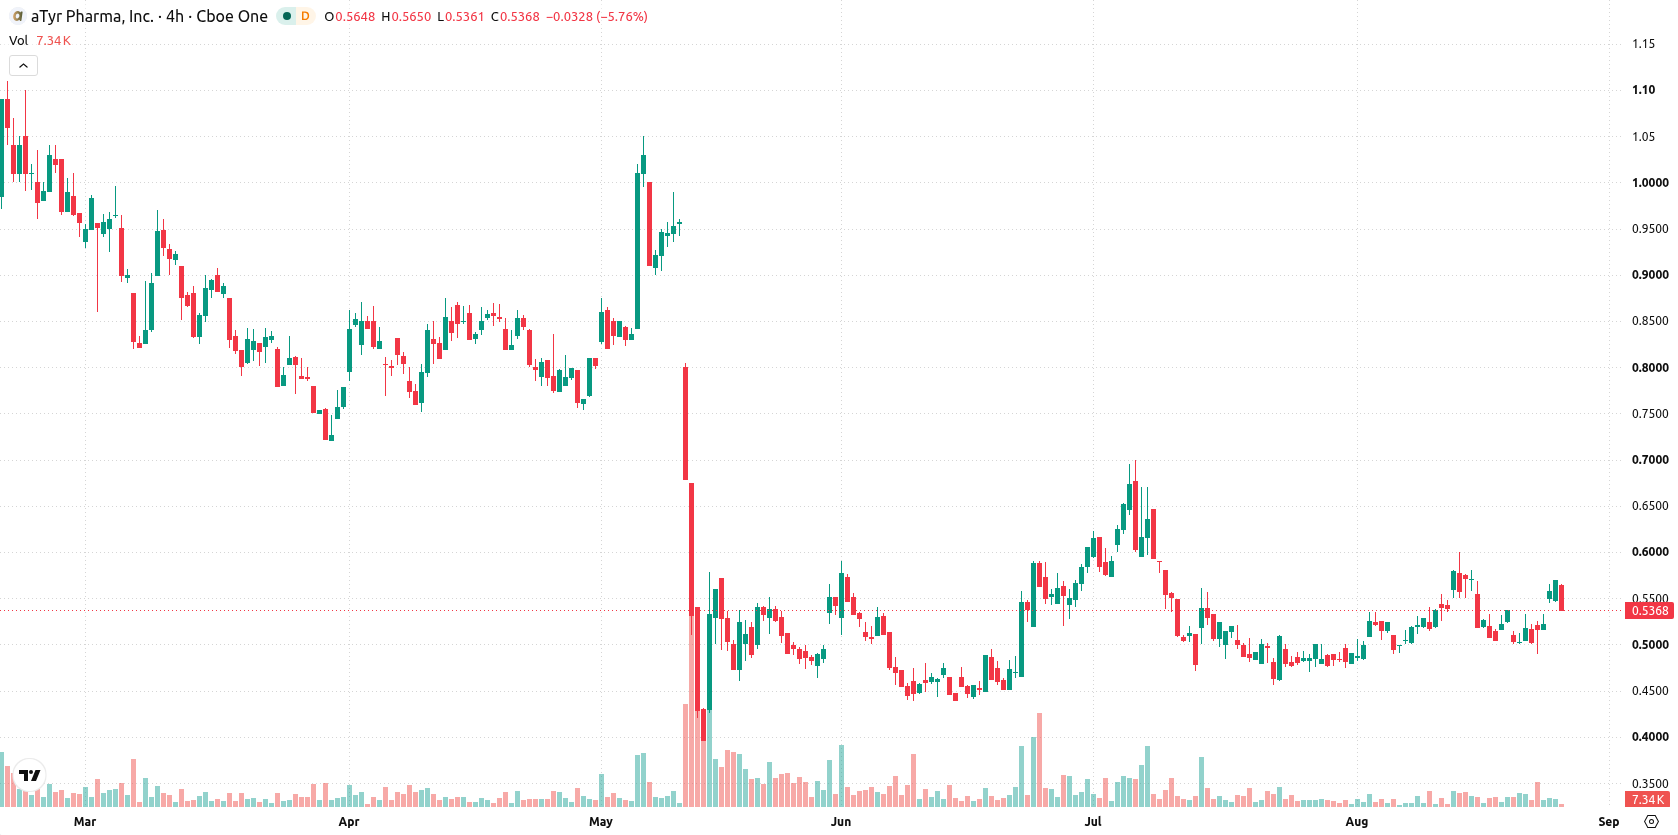
Mixed oscillator signals as short-term gains face overbought risk
aTyr Pharma trades above both its 20-day and 50-day moving averages at $0.52, signaling positive short- and medium-term momentum, but remains below the 200-day average at $0.71, indicating weak longer-term structure. Near-term resistance is capped at $0.57, with support at $0.53; the Ichimoku Kijun at $0.53 also reinforces this support band. Momentum readings present mixed signals. The Moving Average Convergence Divergence (MACD) and Relative Strength Index (RSI) both show a buy bias, suggesting upward traction, but the Average Directional Index (ADX) at 12.12 signals a lack of strong trend. Both the Stochastic RSI (100) and Commodity Channel Index (CCI) (136.42) flash overbought conditions. Bull/Bear Power (BBP) above zero indicates buyers dominate intraday, but the overbought signals warn of exhaustion. The Awesome Oscillator (AO) supports further gains. The stock last traded at $0.54, slipping 4.04% today in a mid-range position after opening nearly flat. Intraday volatility stands at 7.82%. There is mild pressure after the open, with momentum slightly at odds with overbought conditions.
Earlier, analysts noted that aTyr Pharma was dominated by persistent bearish momentum and technical weakness despite intermittent rebounds. The latest analysis marks a shift, highlighting improved short- and medium-term structure, but traders should closely monitor the $0.53 support as renewed selling below this level could increase downside risk.






Latest aTyr Pharma Inc News



-
 Afghanistan
-
 Albania
-
 Algeria
-
 Angola
-
 Argentina
-
 Armenia
-
 Australia
-
 Austria
-
 Azerbaijan
-
 Bahamas
-
 Bahrain
-
 Bangladesh
-
 Belarus
-
 Belgium
-
 Bolivia
-
 Botswana
-
 Brazil
-
 Brunei
-
 Bulgaria
-
 Cambodia
-
 Cameroon
-
 Canada
-
 Chile
-
 China
-
 Colombia
-
 Congo
-
 Costa Rica
-
 Cote d'Ivoire
-
 Croatia
-
 Cuba
-
 Cyprus
-
 Czechia
-
 DR Congo
-
 Denmark
-
 Dominican Republic
-
 Ecuador
-
 Egypt
-
 El Salvador
-
 Estonia
-
 Eswatini
-
 Ethiopia
-
 Finland
-
 France
-
 Georgia
-
 Germany
-
 Ghana
-
 Greece
-
 Haiti
-
 Hong Kong
-
 Hungary
-
 India
-
 Indonesia
-
 Iran, Islamic republic
-
 Iraq
-
 Ireland
-
 Israel
-
 Italy
-
 Jamaica
-
 Japan
-
 Jordan
-
 Kazakhstan
-
 Kenya
-
 Korea
-
 Kuwait
-
 Kyrgyzstan
-
 Laos
-
 Latvia
-
 Lebanon
-
 Lesotho
-
 Libya
-
 Lithuania
-
 Luxembourg
-
 Madagascar
-
 Malaysia
-
 Malta
-
 Mauritius
-
 Mexico
-
 Moldova
-
 Mongolia
-
 Montenegro
-
 Morocco
-
 Mozambique
-
 Myanmar
-
 Namibia
-
 Nepal
-
 Netherlands
-
 New Zealand
-
 Nigeria
-
 North Macedonia
-
 Norway
-
 Oman
-
 Pakistan
-
 Palestine
-
 Panama
-
 Papua New Guinea
-
 Paraguay
-
 Peru
-
 Philippines
-
 Poland
-
 Portugal
-
 Puerto Rico
-
 Qatar
-
 Reunion
-
 Romania
-
 Rwanda
-
 Saudi Arabia
-
 Serbia
-
 Singapore
-
 Slovakia
-
 Slovenia
-
 Somalia
-
 South Africa
-
 Spain
-
 Sri Lanka
-
 Sweden
-
 Switzerland
-
 Syria
-
 Taiwan
-
 Tajikistan
-
 Tanzania
-
 Thailand
-
 Trinidad and Tobago
-
 Tunisia
-
 Turkey
-
 UAE
-
 Uganda
-
 Ukraine
-
 United Kingdom
-
United States
-
 Uruguay
-
 Uzbekistan
-
 Venezuela
-
 Vietnam
-
 Yemen
-
 Zambia
-
 Zimbabwe
- Forex
- Crypto












