

Nano Dimension stock resistance test at $1.67: Resistance levels in focus

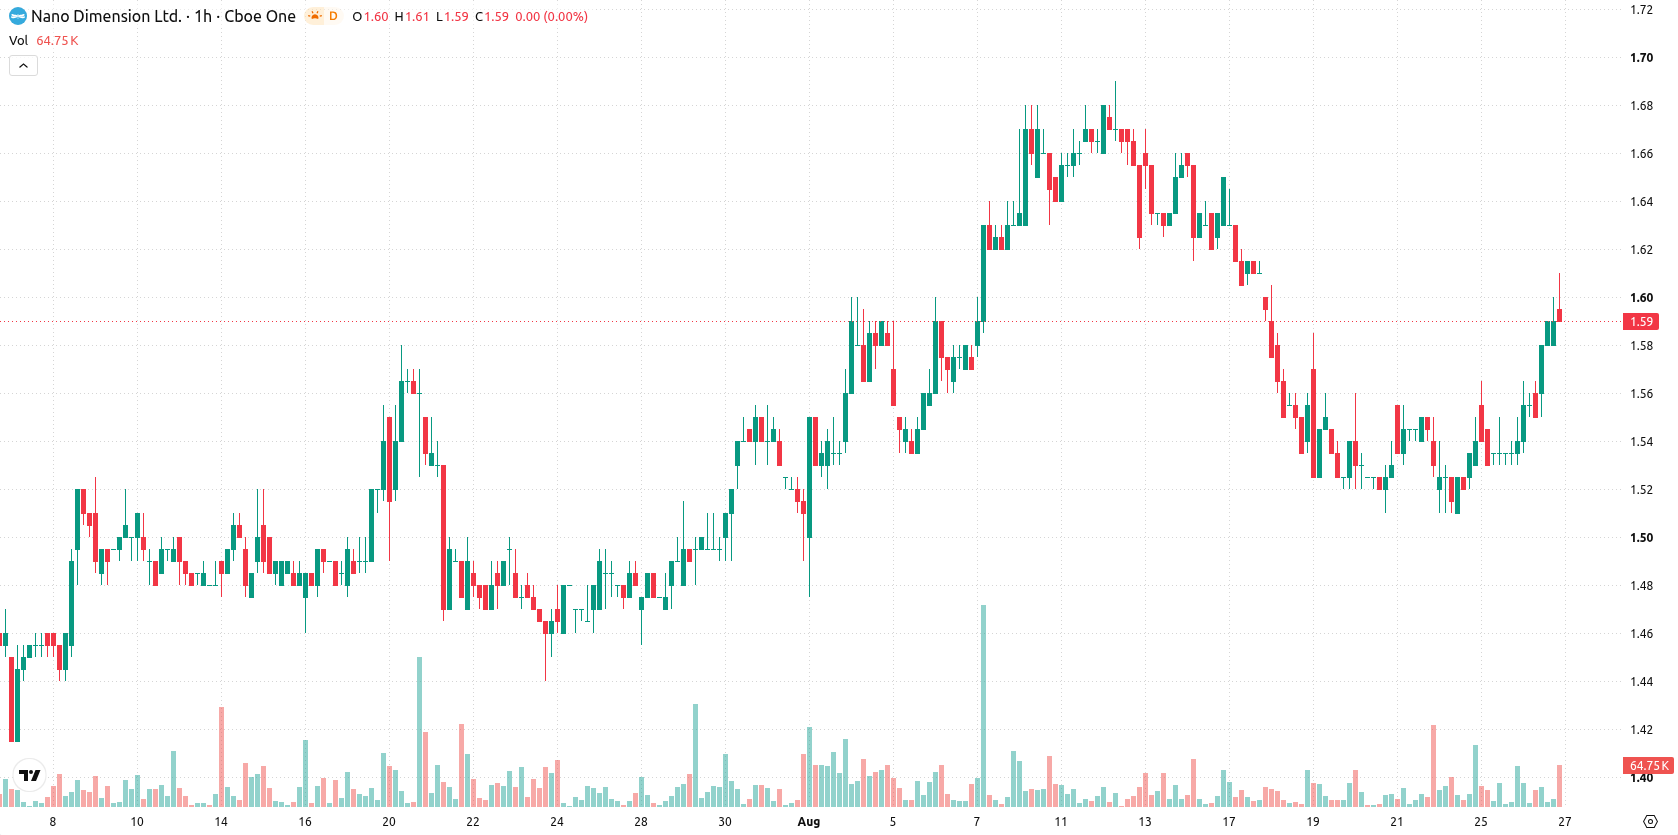
Nano Dimension (NNDM) stock is trading at $1.59, up 3.25% on the day and holding near the session high. The price is positioned above its key short- and medium-term moving averages, indicating strong short-term momentum.
 1.34
1.39
Highlights
- NNDM/USD is trending higher in the short and medium term but faces long-term resistance below the daily MA-200 level.
- Momentum indicators are actively bullish, with MACD and ADX in buy mode, but multiple oscillators are overbought, warning of a possible short-term pullback.
- For the next 2 to 3 trading days, price is expected to stabilize in a $1.55 to $1.65 range, with a high probability of an upward move unless immediate support at $1.56 fails.
Buy signals intensify amid overbought indicators and resistance cap
On the hourly chart, NNDM is trading above both the MA-20 at $1.55 and the MA-50 at $1.54, while it remains below the MA-200 on the daily timeframe at $1.67. The Ichimoku Kijun level at $1.56 acts as immediate support. Momentum indicators confirm strong buying activity: MACD and ADX both present buy signals, while the Bull/Bear Power and Awesome Oscillator indicate buyers are dominant. RSI is at 70.71, firmly in the Buy zone, but Stoch RSI and CCI readings highlight overbought conditions, suggesting that the rally may be short-term stretched.
Price stabilization favored as volatility bands tighten near support
For the next 2–3 trading days, the typical volatility band is expected to range between $1.55 and $1.65. The main scenario calls for price stabilization within this range. If upward momentum persists, NNDM could push towards the upper end of the band. However, a break below immediate support at the Kijun level would signal a higher risk of short-term downside.
Earlier, analysts noted that Nano Dimension's technical outlook was constrained by mixed momentum signals and resistance from longer-term indicators. The current setup strengthens that cautious view, highlighting the importance of the $1.56 Kijun level as a near-term support to monitor, with a break below signaling a potential shift toward downside volatility.






Latest Nano Dimension News




-
 Afghanistan
-
 Albania
-
 Algeria
-
 Angola
-
 Argentina
-
 Armenia
-
 Australia
-
 Austria
-
 Azerbaijan
-
 Bahamas
-
 Bahrain
-
 Bangladesh
-
 Belarus
-
 Belgium
-
 Bolivia
-
 Botswana
-
 Brazil
-
 Brunei
-
 Bulgaria
-
 Cambodia
-
 Cameroon
-
 Canada
-
 Chile
-
 China
-
 Colombia
-
 Congo
-
 Costa Rica
-
 Cote d'Ivoire
-
 Croatia
-
 Cuba
-
 Cyprus
-
 Czechia
-
 DR Congo
-
 Denmark
-
 Dominican Republic
-
 Ecuador
-
 Egypt
-
 El Salvador
-
 Estonia
-
 Eswatini
-
 Ethiopia
-
 Finland
-
 France
-
 Georgia
-
 Germany
-
 Ghana
-
 Greece
-
 Haiti
-
 Hong Kong
-
 Hungary
-
 India
-
 Indonesia
-
 Iran, Islamic republic
-
 Iraq
-
 Ireland
-
 Israel
-
 Italy
-
 Jamaica
-
 Japan
-
 Jordan
-
 Kazakhstan
-
 Kenya
-
 Korea
-
 Kuwait
-
 Kyrgyzstan
-
 Laos
-
 Latvia
-
 Lebanon
-
 Lesotho
-
 Libya
-
 Lithuania
-
 Luxembourg
-
 Madagascar
-
 Malaysia
-
 Malta
-
 Mauritius
-
 Mexico
-
 Moldova
-
 Mongolia
-
 Montenegro
-
 Morocco
-
 Mozambique
-
 Myanmar
-
 Namibia
-
 Nepal
-
 Netherlands
-
 New Zealand
-
 Nigeria
-
 North Macedonia
-
 Norway
-
 Oman
-
 Pakistan
-
 Palestine
-
 Panama
-
 Papua New Guinea
-
 Paraguay
-
 Peru
-
 Philippines
-
 Poland
-
 Portugal
-
 Puerto Rico
-
 Qatar
-
 Reunion
-
 Romania
-
 Rwanda
-
 Saudi Arabia
-
 Serbia
-
 Singapore
-
 Slovakia
-
 Slovenia
-
 Somalia
-
 South Africa
-
 Spain
-
 Sri Lanka
-
 Sweden
-
 Switzerland
-
 Syria
-
 Taiwan
-
 Tajikistan
-
 Tanzania
-
 Thailand
-
 Trinidad and Tobago
-
 Tunisia
-
 Turkey
-
 UAE
-
 Uganda
-
 Ukraine
-
 United Kingdom
-
United States
-
 Uruguay
-
 Uzbekistan
-
 Venezuela
-
 Vietnam
-
 Yemen
-
 Zambia
-
 Zimbabwe
- Forex
- Crypto












