

Support test amid selloff: Can Reckitt Benckiser stock hold key GBX5,105 level?

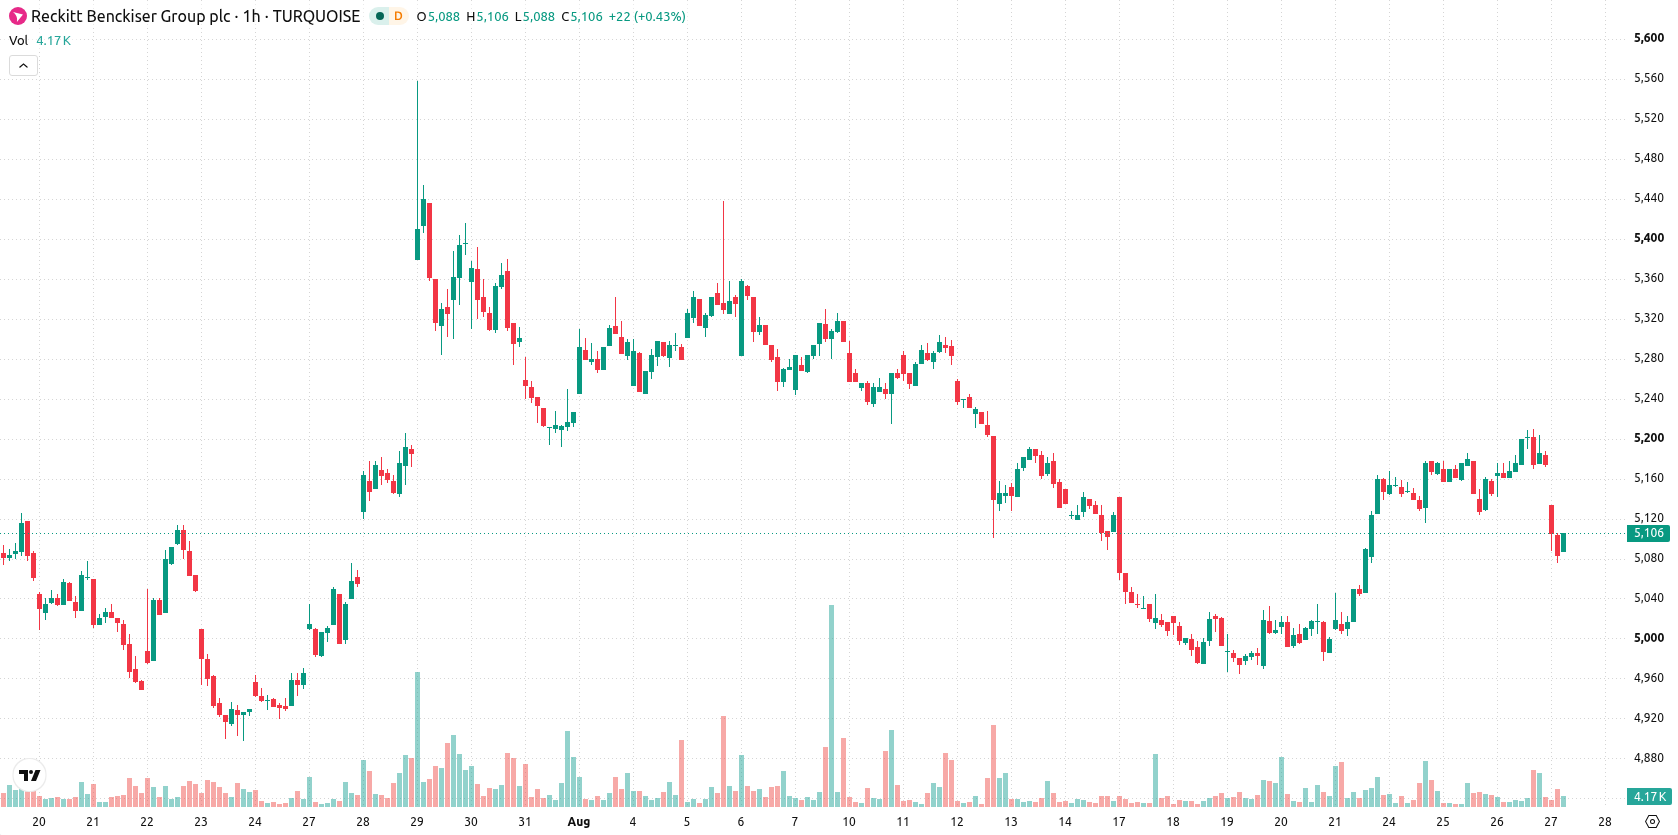
Reckitt Benckiser (RKT) stock is trading at GBX5,106, down today and finishing in the middle of its intraday range. The price sits below its key moving averages on some timeframes, reflecting a period of moderate volatility.
 5716.00
5728.00
Highlights
- RKT/GBX trades below key short-term and long-term moving averages, confirming ongoing bearish pressure in the stock.
- Momentum indicators are mixed as MACD signals strong buy but RSI, ADX and intraday flows indicate prevailing seller control.
- The price is forecast to stay within GBX5,011 to GBX5,202 over coming days, with a 71% chance of further downside.
Conflicting momentum as support holds amid oversold signals
On the H1 chart, RKT/GBX is positioned below the MA-20 (GBX5,159) but just above the MA-50 (GBX5,105). The daily timeframe shows the price below the MA-200 (GBX5,412), with the Ichimoku Kijun set at GBX5,145 as immediate resistance. Momentum indicators present a mixed picture: MACD signals Strong Buy while ADX points to Sell, RSI is at 35.93 (Sell), and both Stoch RSI and CCI indicate oversold conditions. Bull/Bear Power highlights intraday dominance by sellers, and the Awesome Oscillator remains neutral, contributing to an environment of short-term uncertainty as downside exhaustion signals are not corroborated by trend strength measures.
Downside bias prevails as resistance blocks recovery
Over the coming days, RKT is expected to fluctuate within a range of GBX5,011 to GBX5,202, reflecting typical volatility for the current environment. With a 71% probability of additional downside versus 29% for an upward move, scenarios favor a continuation within this band. For a recovery to materialize, the price would need to break above immediate resistance. Alternatively, extended declines could unfold if the price drops below recent support levels.
Earlier, analysts noted that Reckitt Benckiser's persistent technical weakness and volatility called for close monitoring of trend signals and key support levels. The current setup reinforces these concerns, as momentum remains mixed and downside risk prevails, making sustained price action above immediate resistance crucial for any recovery attempt.











-
 Afghanistan
-
 Albania
-
 Algeria
-
 Angola
-
 Argentina
-
 Armenia
-
 Australia
-
 Austria
-
 Azerbaijan
-
 Bahamas
-
 Bahrain
-
 Bangladesh
-
 Belarus
-
 Belgium
-
 Bolivia
-
 Botswana
-
 Brazil
-
 Brunei
-
 Bulgaria
-
 Cambodia
-
 Cameroon
-
 Canada
-
 Chile
-
 China
-
 Colombia
-
 Congo
-
 Costa Rica
-
 Cote d'Ivoire
-
 Croatia
-
 Cuba
-
 Cyprus
-
 Czechia
-
 DR Congo
-
 Denmark
-
 Dominican Republic
-
 Ecuador
-
 Egypt
-
 El Salvador
-
 Estonia
-
 Eswatini
-
 Ethiopia
-
 Finland
-
 France
-
 Georgia
-
 Germany
-
 Ghana
-
 Greece
-
 Haiti
-
 Hong Kong
-
 Hungary
-
 India
-
 Indonesia
-
 Iran, Islamic republic
-
 Iraq
-
 Ireland
-
 Israel
-
 Italy
-
 Jamaica
-
 Japan
-
 Jordan
-
 Kazakhstan
-
 Kenya
-
 Korea
-
 Kuwait
-
 Kyrgyzstan
-
 Laos
-
 Latvia
-
 Lebanon
-
 Lesotho
-
 Libya
-
 Lithuania
-
 Luxembourg
-
 Madagascar
-
 Malaysia
-
 Malta
-
 Mauritius
-
 Mexico
-
 Moldova
-
 Mongolia
-
 Montenegro
-
 Morocco
-
 Mozambique
-
 Myanmar
-
 Namibia
-
 Nepal
-
 Netherlands
-
 New Zealand
-
 Nigeria
-
 North Macedonia
-
 Norway
-
 Oman
-
 Pakistan
-
 Palestine
-
 Panama
-
 Papua New Guinea
-
 Paraguay
-
 Peru
-
 Philippines
-
 Poland
-
 Portugal
-
 Puerto Rico
-
 Qatar
-
 Reunion
-
 Romania
-
 Rwanda
-
 Saudi Arabia
-
 Serbia
-
 Singapore
-
 Slovakia
-
 Slovenia
-
 Somalia
-
 South Africa
-
 Spain
-
 Sri Lanka
-
 Sweden
-
 Switzerland
-
 Syria
-
 Taiwan
-
 Tajikistan
-
 Tanzania
-
 Thailand
-
 Trinidad and Tobago
-
 Tunisia
-
 Turkey
-
 UAE
-
 Uganda
-
 Ukraine
-
 United Kingdom
-
United States
-
 Uruguay
-
 Uzbekistan
-
 Venezuela
-
 Vietnam
-
 Yemen
-
 Zambia
-
 Zimbabwe
- Forex
- Crypto












