

McDonald's shares weekly forecast: MACD remains in sell territory while Stochastic RSI nears oversold

Shares of McDonald's Corporation (MCD) are trading near $263 after pulling back a bit more than 2% over the past week, as sellers continue to dominate and keep the setup deep in oversold territory. Momentum continues to paint a cautious outlook, with technical resistance likely to limit any rebounds in the coming days.
 262.88
Highlights
- Shares of McDonald's fell 2.93% over the past week, now trading at $263.08 and holding below key moving averages.
- The technical trend remains bearish, with downward momentum prevailing and short-term oscillators nearing oversold levels.
- Expected five-day price range is $259.81 to $275.65, with resistance at $266.11 and $269.83 likely to limit rallies.
Brand initiatives and digital strategy shape sentiment amid steady sales
McDonald's launched its first energy beverage, the Red Bull Dragonberry Energizer, at U.S. restaurants in a bid to win over younger customers, according to Simply Wall St News and ad-hoc-news.de. The company also unveiled the 'World Heist' menu in Canada on August 18, 2026, offering selections from several international markets, as reported by TechStock². Recent updates show modest growth in global comparable sales and a unification of its digital platform to streamline app experiences, per McDonald's press release recapped by Pintu Academy and Simply Wall St News.
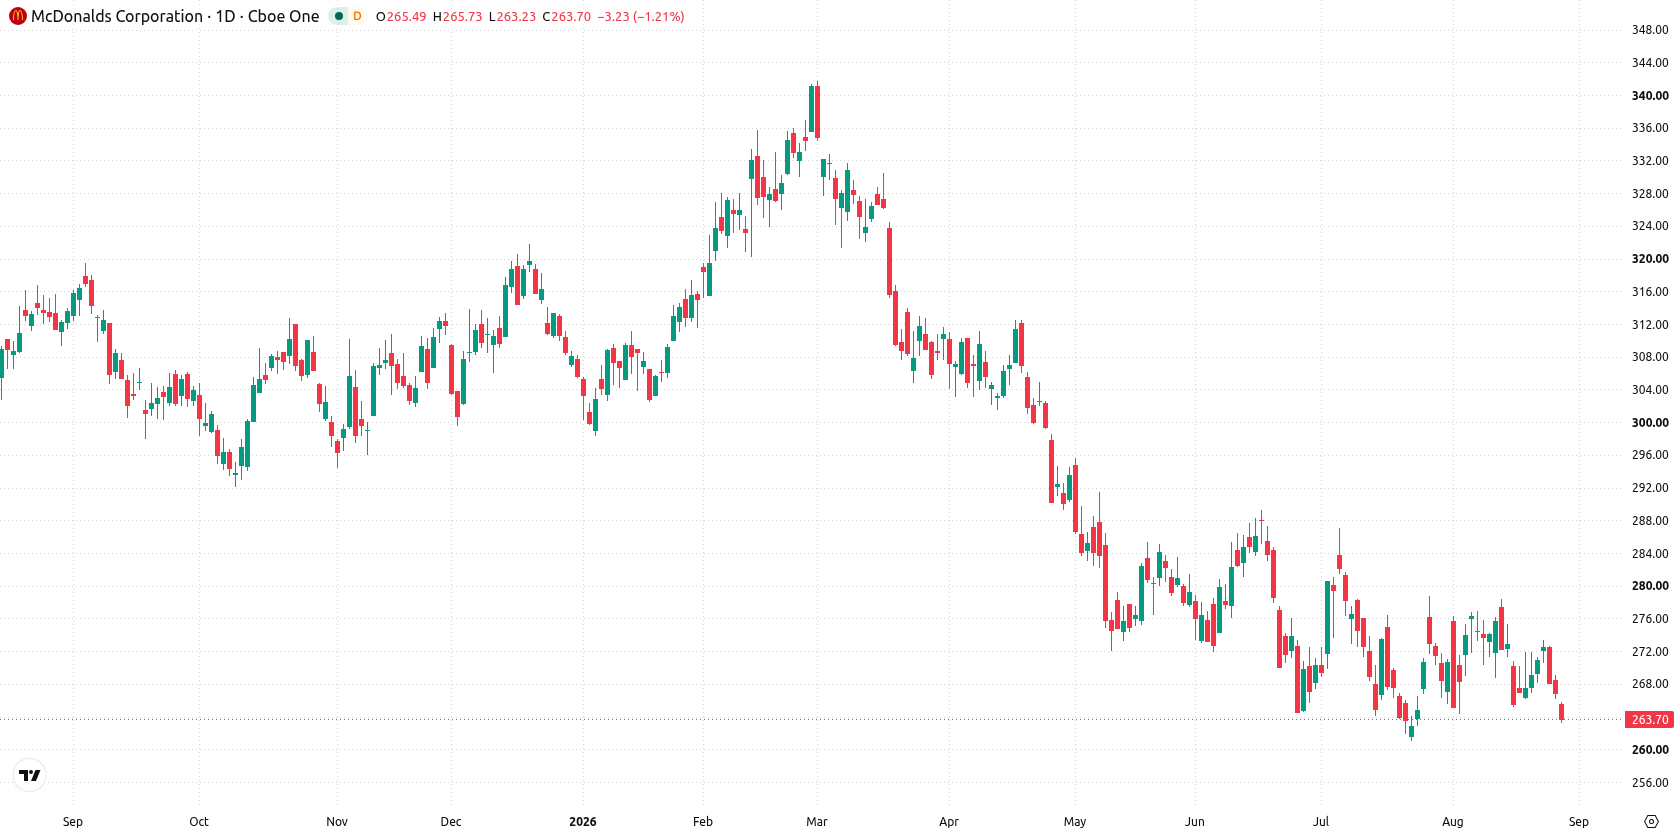
Downside momentum persists as technical barriers limit upside this week
On the daily chart, the setup points to continued weakness, with price trending well below key averages and momentum signals reflecting a contained move within a narrow range. MACD remains in sell territory while the Stochastic RSI is approaching oversold at 29.39, and volatility over the past week registered 2.75%. Immediate resistance stands at $266.11 from the recent weekly low, while the Ichimoku Kijun at $269.83 also acts as resistance. This setup suggests that downward pressure is dominating and rallies are likely to be capped at these resistance levels.
Further downside expected as resistance hampers upside for the week ahead
Over the next five trading days, the expected range is $259.81 to $275.65. There is a very low probability (less than 20%) of a sustained rise and a very high probability (more than 80%) of further decline. The base case is continued consolidation below $266.11, with upside attempts likely struggling against resistance at $266.11 and $269.83. Should the stock break above $269.83, a move toward the upper end of the range is possible. If it slips below $259.81, a deeper retracement could follow.
Earlier, analysts noted that McDonald's shares were facing downside risk amid ongoing technical weakness and consolidation at major support levels. The current analysis reinforces this cautious outlook, with the prevailing scenario suggesting traders should closely monitor $266.11 and $269.83 as critical resistance thresholds that could determine near-term direction.






Latest McDonald’s News



-
 Afghanistan
-
 Albania
-
 Algeria
-
 Angola
-
 Argentina
-
 Armenia
-
 Australia
-
 Austria
-
 Azerbaijan
-
 Bahamas
-
 Bahrain
-
 Bangladesh
-
 Belarus
-
 Belgium
-
 Bolivia
-
 Botswana
-
 Brazil
-
 Brunei
-
 Bulgaria
-
 Cambodia
-
 Cameroon
-
 Canada
-
 Chile
-
 China
-
 Colombia
-
 Congo
-
 Costa Rica
-
 Cote d'Ivoire
-
 Croatia
-
 Cuba
-
 Cyprus
-
 Czechia
-
 DR Congo
-
 Denmark
-
 Dominican Republic
-
 Ecuador
-
 Egypt
-
 El Salvador
-
 Estonia
-
 Eswatini
-
 Ethiopia
-
 Finland
-
 France
-
 Georgia
-
 Germany
-
 Ghana
-
 Greece
-
 Haiti
-
 Hong Kong
-
 Hungary
-
 India
-
 Indonesia
-
 Iran, Islamic republic
-
 Iraq
-
 Ireland
-
 Israel
-
 Italy
-
 Jamaica
-
 Japan
-
 Jordan
-
 Kazakhstan
-
 Kenya
-
 Korea
-
 Kuwait
-
 Kyrgyzstan
-
 Laos
-
 Latvia
-
 Lebanon
-
 Lesotho
-
 Libya
-
 Lithuania
-
 Luxembourg
-
 Madagascar
-
 Malaysia
-
 Malta
-
 Mauritius
-
 Mexico
-
 Moldova
-
 Mongolia
-
 Montenegro
-
 Morocco
-
 Mozambique
-
 Myanmar
-
 Namibia
-
 Nepal
-
 Netherlands
-
 New Zealand
-
 Nigeria
-
 North Macedonia
-
 Norway
-
 Oman
-
 Pakistan
-
 Palestine
-
 Panama
-
 Papua New Guinea
-
 Paraguay
-
 Peru
-
 Philippines
-
 Poland
-
 Portugal
-
 Puerto Rico
-
 Qatar
-
 Reunion
-
 Romania
-
 Rwanda
-
 Saudi Arabia
-
 Serbia
-
 Singapore
-
 Slovakia
-
 Slovenia
-
 Somalia
-
 South Africa
-
 Spain
-
 Sri Lanka
-
 Sweden
-
 Switzerland
-
 Syria
-
 Taiwan
-
 Tajikistan
-
 Tanzania
-
 Thailand
-
 Trinidad and Tobago
-
 Tunisia
-
 Turkey
-
 UAE
-
 Uganda
-
 Ukraine
-
 United Kingdom
-
United States
-
 Uruguay
-
 Uzbekistan
-
 Venezuela
-
 Vietnam
-
 Yemen
-
 Zambia
-
 Zimbabwe
- Forex
- Crypto












