


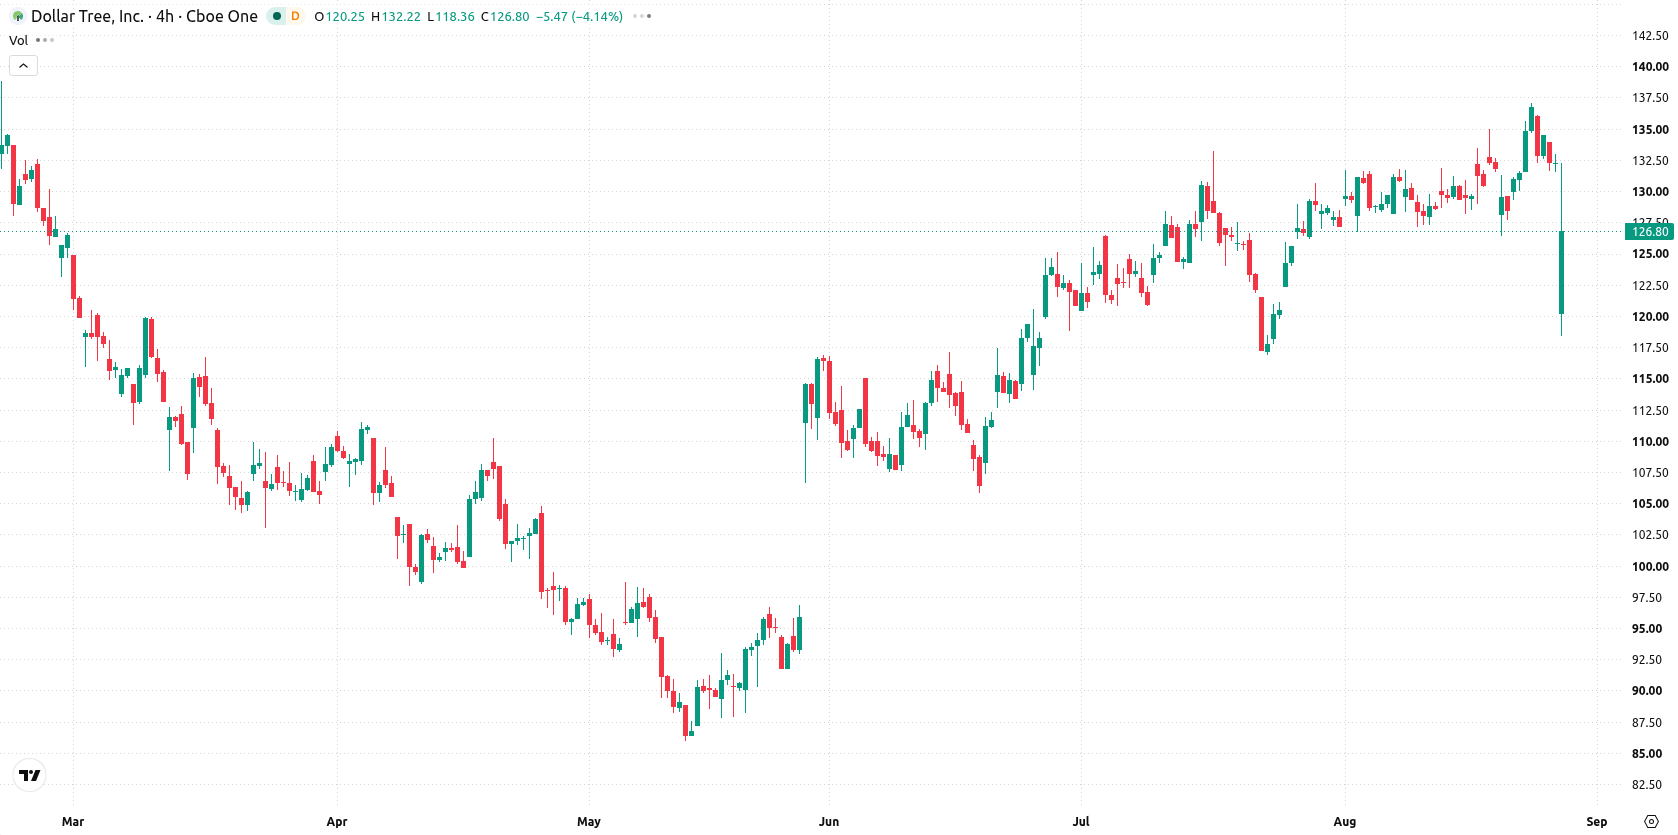
Dollar Tree Inc (DLTR) fell 3.88% after the company issued weaker-than-expected guidance for the third quarter, even as it reported strong second quarter results above analyst estimates. The down move is partially limited, as DLTR is trading below its 20-day moving average but remains above both the 50-day and 200-day averages, indicating underlying medium- and long-term strength.
 119.75
119.75
119.75
Highlights
- Dollar Tree stock fell 3.88% to $127.07 after the company topped expectations for earnings and revenue but issued weaker third quarter guidance.
- Quarterly income from continuing operations reached $515 million with earnings per share of $2.70, benefiting from $1.31 in tariff refunds, and the company raised its full-year earnings outlook.
- The stock is under short-term selling pressure despite strong momentum signals, with trading expected in a $117 to $130.88 range and key levels at $126.94 support and $129.28 resistance.
Weaker forward outlook drives selling pressure after earnings beat
Dollar Tree, Inc. reported its second quarter fiscal 2026 results, surpassing Wall Street analyst expectations for both revenue and earnings. Income from continuing operations reached $515 million and diluted earnings per share was $2.70, including a $1.31 benefit from tariff refunds. Quarterly revenue totaled $4.89 billion, exceeding projections, while shares dropped in response to the company's weaker third quarter guidance. Dollar Tree also raised its full-year adjusted earnings outlook and increased its full-year 2026 guidance, though price action has remained under broader selling pressure.
Short-term weakness persists as momentum indicators signal bullish undercurrent
Dollar Tree is trading below its 20-day moving average at $130.27, but remains above both the 50-day ($125.02) and 200-day ($116.25) moving averages. This setup points to short-term bearish pressure but confirms a medium- and long-term bullish structure, with the nearest support at $126.94 (Ichimoku Kijun) and resistance at $129.28. Momentum readings show strong underlying strength: the Relative Strength Index (RSI) is at 56.41 and signals a buy, with both MACD (3) and Average Directional Index (ADX) also pointing to further upside potential. The Commodity Channel Index (CCI) and Bull/Bear Power (BBP) both indicate overbought conditions, with the latter showing buyers dominate intraday action. The Stochastic RSI is neutral, and Awesome Oscillator remains steady. The stock is sitting mid-range with intraday volatility at a high 10.10%. Selling pressure has followed a downside gap, but momentum signals generally confirm medium-term strength despite some overbought readings and a volatile session.
Earlier, analysts noted that Dollar Tree’s short-term technical outlook was pressured by selling, but the overall trend retained medium- and long-term bullish strength. The current report strengthens this view with updated earnings and guidance, highlighting that near-term price action will hinge on whether support at $126.94 holds in the face of recent volatility.









-
 Afghanistan
-
 Albania
-
 Algeria
-
 Angola
-
 Argentina
-
 Armenia
-
 Australia
-
 Austria
-
 Azerbaijan
-
 Bahamas
-
 Bahrain
-
 Bangladesh
-
 Belarus
-
 Belgium
-
 Bolivia
-
 Botswana
-
 Brazil
-
 Brunei
-
 Bulgaria
-
 Cambodia
-
 Cameroon
-
 Canada
-
 Chile
Chile
-
 China
China
-
 Colombia
-
 Congo
Congo
-
 Costa Rica
-
 Cote d'Ivoire
-
 Croatia
-
 Cuba
Cuba
-
 Cyprus
-
 Czechia
-
 DR Congo
-
 Denmark
-
 Dominican Republic
-
 Ecuador
-
 Egypt
Egypt
-
 El Salvador
-
 Estonia
-
 Eswatini
-
 Ethiopia
-
 Finland
-
 France
-
 Georgia
-
 Germany
-
 Ghana
Ghana
-
 Greece
-
 Haiti
Haiti
-
 Hong Kong
-
 Hungary
-
 India
India
-
 Indonesia
-
 Iran, Islamic republic
-
 Iraq
Iraq
-
 Ireland
-
 Israel
-
 Italy
Italy
-
 Jamaica
-
 Japan
Japan
-
 Jordan
-
 Kazakhstan
-
 Kenya
Kenya
-
 Korea
Korea
-
 Kuwait
-
 Kyrgyzstan
-
 Laos
Laos
-
 Latvia
-
 Lebanon
-
 Lesotho
-
 Libya
Libya
-
 Lithuania
-
 Luxembourg
-
 Madagascar
-
 Malaysia
-
 Malta
Malta
-
 Mauritius
-
 Mexico
-
 Moldova
-
 Mongolia
-
 Montenegro
-
 Morocco
-
 Mozambique
-
 Myanmar
-
 Namibia
-
 Nepal
Nepal
-
 Netherlands
-
 New Zealand
-
 Nigeria
-
 North Macedonia
-
 Norway
-
 Oman
Oman
-
 Pakistan
-
 Palestine
-
 Panama
-
 Papua New Guinea
-
 Paraguay
-
 Peru
Peru
-
 Philippines
-
 Poland
-
 Portugal
-
 Puerto Rico
-
 Qatar
Qatar
-
 Reunion
-
 Romania
-
 Rwanda
-
 Saudi Arabia
-
 Serbia
-
 Singapore
-
 Slovakia
-
 Slovenia
-
 Somalia
-
 South Africa
-
 Spain
Spain
-
 Sri Lanka
-
 Sweden
-
 Switzerland
-
 Syria
Syria
-
 Taiwan
-
 Tajikistan
-
 Tanzania
-
 Thailand
-
 Trinidad and Tobago
-
 Tunisia
-
 Turkey
-
 UAE
UAE
-
 Uganda
-
 Ukraine
-
 United Kingdom
-
United States
-
 Uruguay
-
 Uzbekistan
-
 Venezuela
-
 Vietnam
-
 Yemen
Yemen
-
 Zambia
-
 Zimbabwe
- Forex
- Crypto












