

CHKP climbs nearly 4% after intraday momentum and recovery signals

Check Point Software Technologies Ltd (CHKP) surged 3.74% as strong intraday buying sparked a sharp upside move driven by technical momentum and short-term recovery signals. The rally looks limited, with the stock still trading below its 200-day average and bearish indicators hinting at persistent seller pressure.
 159.50
162.27
Highlights
- Check Point Software stock trades above short- and medium-term averages but remains below the long-term average, indicating a bearish long-term alignment.
- Momentum indicators lean negative with strong sell signals from MACD and RSI, while trend strength remains neutral.
- Shares rose $4.83 or 3.74% with volatility at 3.5%, but there is a more than 80% probability of a move to the $131.56 support level over the next five days.
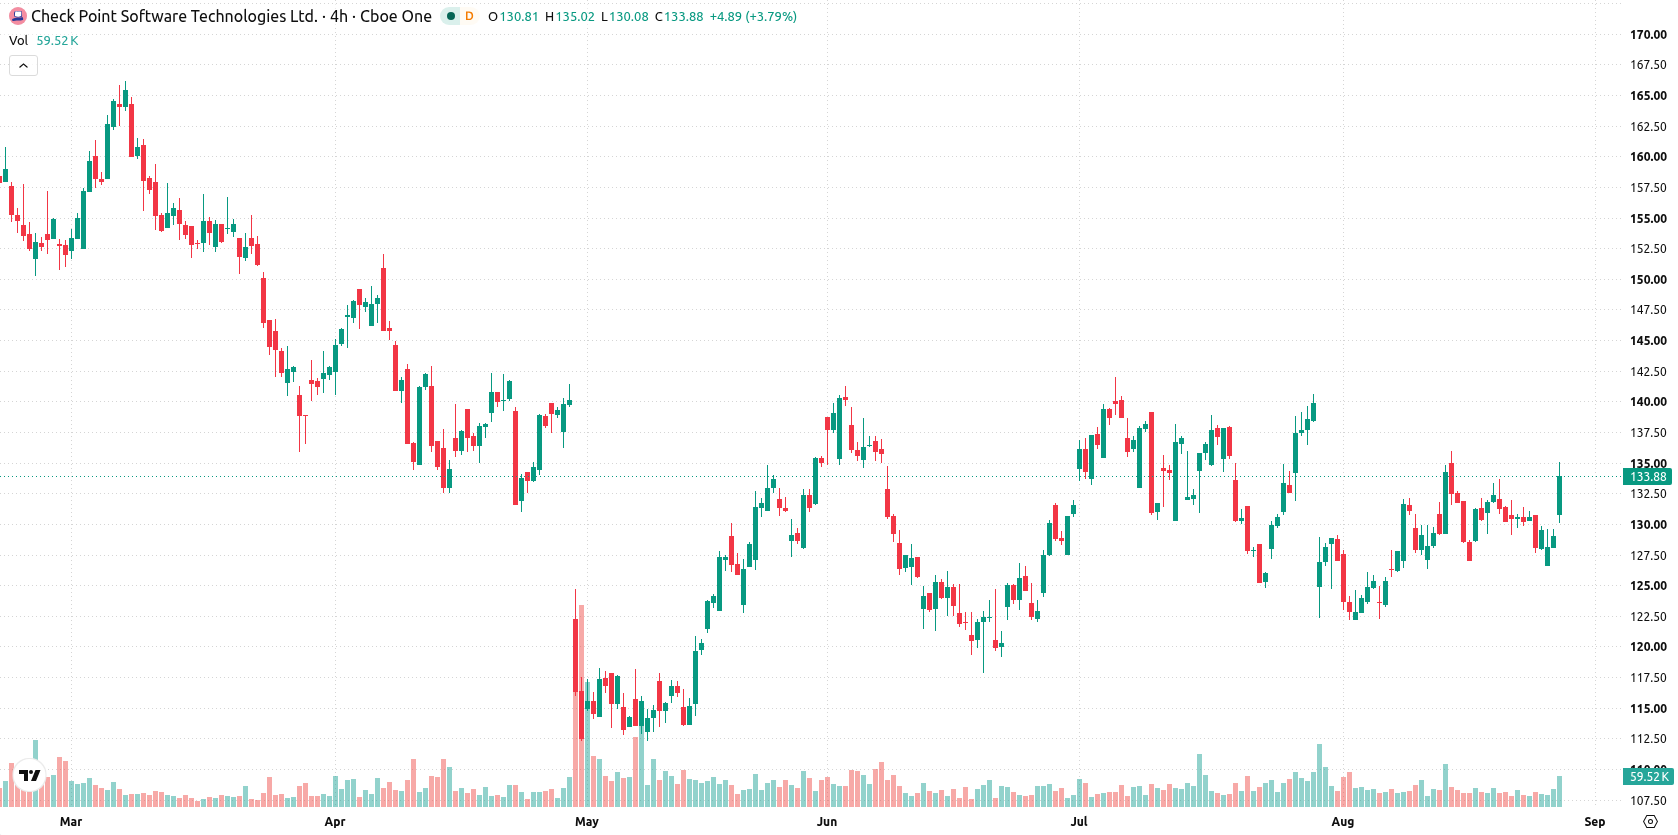
Mixed momentum with seller dominance as technical barriers hold
Check Point Software is trading above both its 20-day ($128.79) and 50-day ($130.34) moving averages, but remains below the 200-day ($153.09) average, indicating short- and medium-term recovery within a bearish long-term alignment. Immediate resistance is near the session high at $134.97, while support is at $131.9. Momentum signals are mixed: the MACD is negative and forecasting a strong sell, and the ADX is neutral, suggesting no dominant trend. The RSI has moved to 48.08 and also leans sell, while Stochastic RSI and Commodity Channel Index (CCI) are neutral. Bull/Bear Power (BBP) is negative at -0.32, indicating sellers dominated intraday, with a forecast of oversold. The stock rose $4.83 or 3.74% with an upside gap of about 1.42% and is now trading near the day’s high. Intraday volatility stands at 3.50%. Momentum indicators suggest persistent seller pressure despite today’s strong upward move, hinting at a potential retracement or ongoing consolidation.
Previously it was reported that regulators closely monitor unusual market activity and require public clarification processes to maintain transparency for investors. Today's data-driven analysis of Check Point Software adds a technical perspective to such monitoring, highlighting that the prevailing scenario is one of constrained recovery within a bearish alignment, with close attention warranted on the $131.56–$141.16 range for emerging directional cues.






Latest Check Point Software Technologies Ltd News





-
 Afghanistan
-
 Albania
-
 Algeria
-
 Angola
-
 Argentina
-
 Armenia
-
 Australia
-
 Austria
-
 Azerbaijan
-
 Bahamas
-
 Bahrain
-
 Bangladesh
-
 Belarus
-
 Belgium
-
 Bolivia
-
 Botswana
-
 Brazil
-
 Brunei
-
 Bulgaria
-
 Cambodia
-
 Cameroon
-
 Canada
-
 Chile
-
 China
-
 Colombia
-
 Congo
-
 Costa Rica
-
 Cote d'Ivoire
-
 Croatia
-
 Cuba
-
 Cyprus
-
 Czechia
-
 DR Congo
-
 Denmark
-
 Dominican Republic
-
 Ecuador
-
 Egypt
-
 El Salvador
-
 Estonia
-
 Eswatini
-
 Ethiopia
-
 Finland
-
 France
-
 Georgia
-
 Germany
-
 Ghana
-
 Greece
-
 Haiti
-
 Hong Kong
-
 Hungary
-
 India
-
 Indonesia
-
 Iran, Islamic republic
-
 Iraq
-
 Ireland
-
 Israel
-
 Italy
-
 Jamaica
-
 Japan
-
 Jordan
-
 Kazakhstan
-
 Kenya
-
 Korea
-
 Kuwait
-
 Kyrgyzstan
-
 Laos
-
 Latvia
-
 Lebanon
-
 Lesotho
-
 Libya
-
 Lithuania
-
 Luxembourg
-
 Madagascar
-
 Malaysia
-
 Malta
-
 Mauritius
-
 Mexico
-
 Moldova
-
 Mongolia
-
 Montenegro
-
 Morocco
-
 Mozambique
-
 Myanmar
-
 Namibia
-
 Nepal
-
 Netherlands
-
 New Zealand
-
 Nigeria
-
 North Macedonia
-
 Norway
-
 Oman
-
 Pakistan
-
 Palestine
-
 Panama
-
 Papua New Guinea
-
 Paraguay
-
 Peru
-
 Philippines
-
 Poland
-
 Portugal
-
 Puerto Rico
-
 Qatar
-
 Reunion
-
 Romania
-
 Rwanda
-
 Saudi Arabia
-
 Serbia
-
 Singapore
-
 Slovakia
-
 Slovenia
-
 Somalia
-
 South Africa
-
 Spain
-
 Sri Lanka
-
 Sweden
-
 Switzerland
-
 Syria
-
 Taiwan
-
 Tajikistan
-
 Tanzania
-
 Thailand
-
 Trinidad and Tobago
-
 Tunisia
-
 Turkey
-
 UAE
-
 Uganda
-
 Ukraine
-
 United Kingdom
-
United States
-
 Uruguay
-
 Uzbekistan
-
 Venezuela
-
 Vietnam
-
 Yemen
-
 Zambia
-
 Zimbabwe
- Forex
- Crypto












