

What's behind Peloton's latest 3.6% stock surge?

Peloton Interactive, Inc. (PTON) gained 3.57% as sellers covered positions and technical drivers dominated trading on the day. The rebound looks limited, with Peloton still trading below its 20-, 50-, and 200-day moving averages.
 5.80
6.00
Highlights
- Peloton stock trades below short-, medium-, and long-term moving averages at $5.51, signaling persistent downside pressure.
- Momentum indicators stay negative across MACD, RSI, and CCI, with sellers holding intraday control but no oversold signal.
- Shares face resistance at $5.56 and support at $5.47, with an 80% chance of a move lower within the $5.42 to $5.59 range over five days.
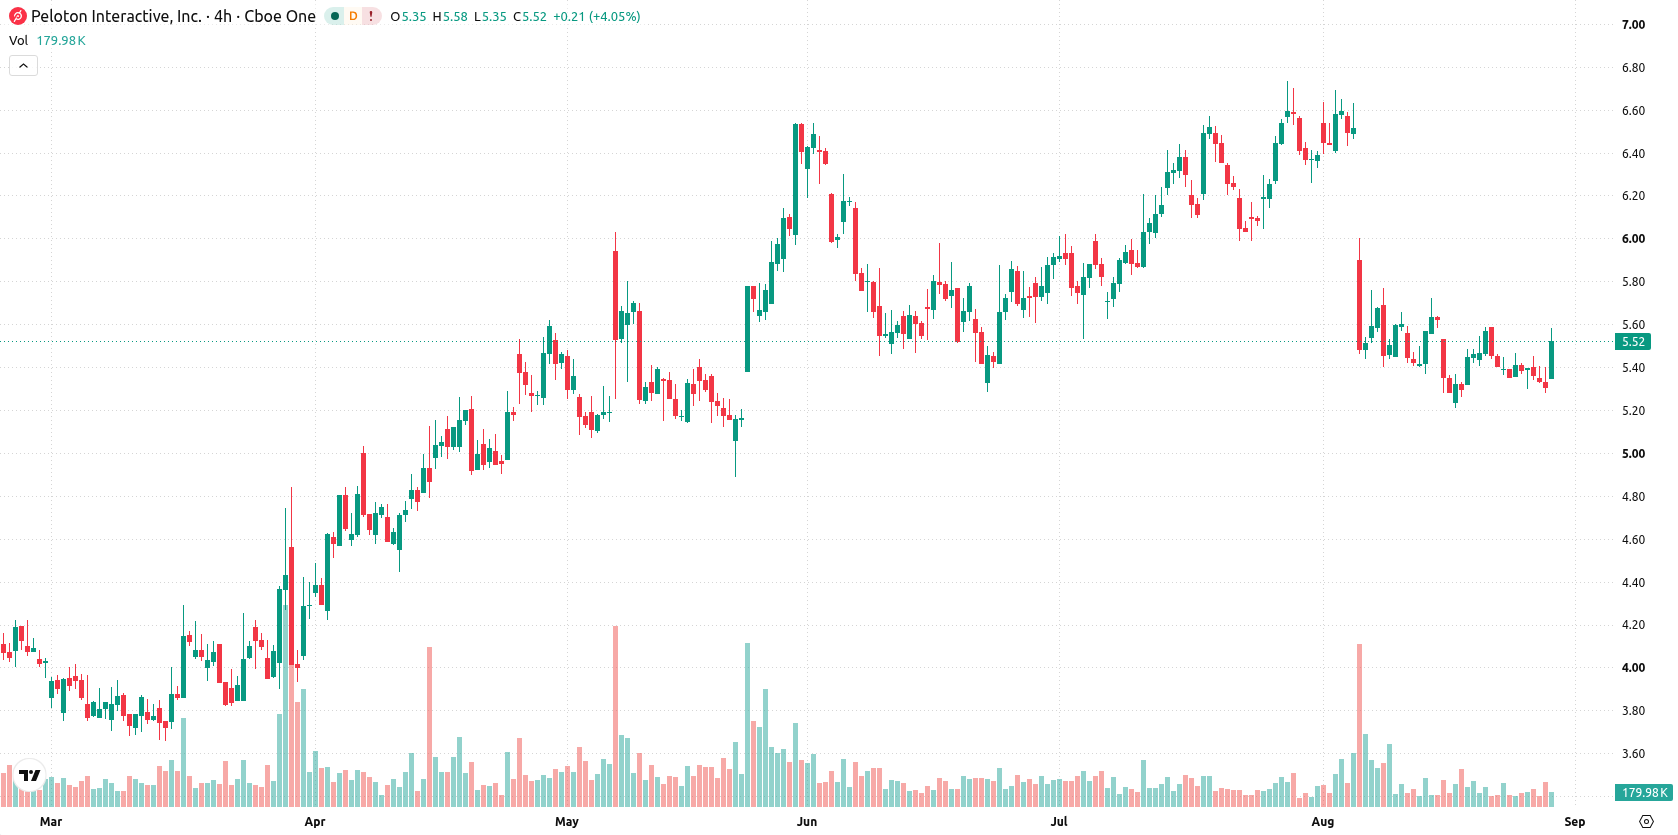
Seller momentum persists as price lags technical benchmarks
Peloton trades below its 20-, 50-, and 200-day moving averages at $5.51, indicating ongoing short-, medium-, and longer-term pressure from sellers. The near-term ceiling is set at $5.56, with support at the day’s low of $5.47. Longer-term structure remains bullish based on the alignment of the 50- and 200-day averages. Momentum signals are negative: both the MACD and Relative Strength Index (RSI) forecast selling, with the RSI at 39.8 and Commodity Channel Index (CCI) at -70.26, showing a lingering bearish tone without being oversold. Stochastic RSI favors sellers, and Bull/Bear Power (BBP) is negative, confirming sellers control intraday momentum. Intraday volatility stands at 1.83%. The overall setup points to sideways consolidation with a seller's edge, as negative momentum is not fully confirmed by the modest price recovery.
Previously it was reported that Peloton’s move to profitability was tempered by technical weakness and persistent downside risk. The current setup continues to support a cautious outlook, with traders advised to monitor the $5.47 support for signs of renewed selling momentum.






Latest Peloton Interactive News




-
 Afghanistan
-
 Albania
-
 Algeria
-
 Angola
-
 Argentina
-
 Armenia
-
 Australia
-
 Austria
-
 Azerbaijan
-
 Bahamas
-
 Bahrain
-
 Bangladesh
-
 Belarus
-
 Belgium
-
 Bolivia
-
 Botswana
-
 Brazil
-
 Brunei
-
 Bulgaria
-
 Cambodia
-
 Cameroon
-
 Canada
-
 Chile
-
 China
-
 Colombia
-
 Congo
-
 Costa Rica
-
 Cote d'Ivoire
-
 Croatia
-
 Cuba
-
 Cyprus
-
 Czechia
-
 DR Congo
-
 Denmark
-
 Dominican Republic
-
 Ecuador
-
 Egypt
-
 El Salvador
-
 Estonia
-
 Eswatini
-
 Ethiopia
-
 Finland
-
 France
-
 Georgia
-
 Germany
-
 Ghana
-
 Greece
-
 Haiti
-
 Hong Kong
-
 Hungary
-
 India
-
 Indonesia
-
 Iran, Islamic republic
-
 Iraq
-
 Ireland
-
 Israel
-
 Italy
-
 Jamaica
-
 Japan
-
 Jordan
-
 Kazakhstan
-
 Kenya
-
 Korea
-
 Kuwait
-
 Kyrgyzstan
-
 Laos
-
 Latvia
-
 Lebanon
-
 Lesotho
-
 Libya
-
 Lithuania
-
 Luxembourg
-
 Madagascar
-
 Malaysia
-
 Malta
-
 Mauritius
-
 Mexico
-
 Moldova
-
 Mongolia
-
 Montenegro
-
 Morocco
-
 Mozambique
-
 Myanmar
-
 Namibia
-
 Nepal
-
 Netherlands
-
 New Zealand
-
 Nigeria
-
 North Macedonia
-
 Norway
-
 Oman
-
 Pakistan
-
 Palestine
-
 Panama
-
 Papua New Guinea
-
 Paraguay
-
 Peru
-
 Philippines
-
 Poland
-
 Portugal
-
 Puerto Rico
-
 Qatar
-
 Reunion
-
 Romania
-
 Rwanda
-
 Saudi Arabia
-
 Serbia
-
 Singapore
-
 Slovakia
-
 Slovenia
-
 Somalia
-
 South Africa
-
 Spain
-
 Sri Lanka
-
 Sweden
-
 Switzerland
-
 Syria
-
 Taiwan
-
 Tajikistan
-
 Tanzania
-
 Thailand
-
 Trinidad and Tobago
-
 Tunisia
-
 Turkey
-
 UAE
-
 Uganda
-
 Ukraine
-
 United Kingdom
-
United States
-
 Uruguay
-
 Uzbekistan
-
 Venezuela
-
 Vietnam
-
 Yemen
-
 Zambia
-
 Zimbabwe
- Forex
- Crypto












