


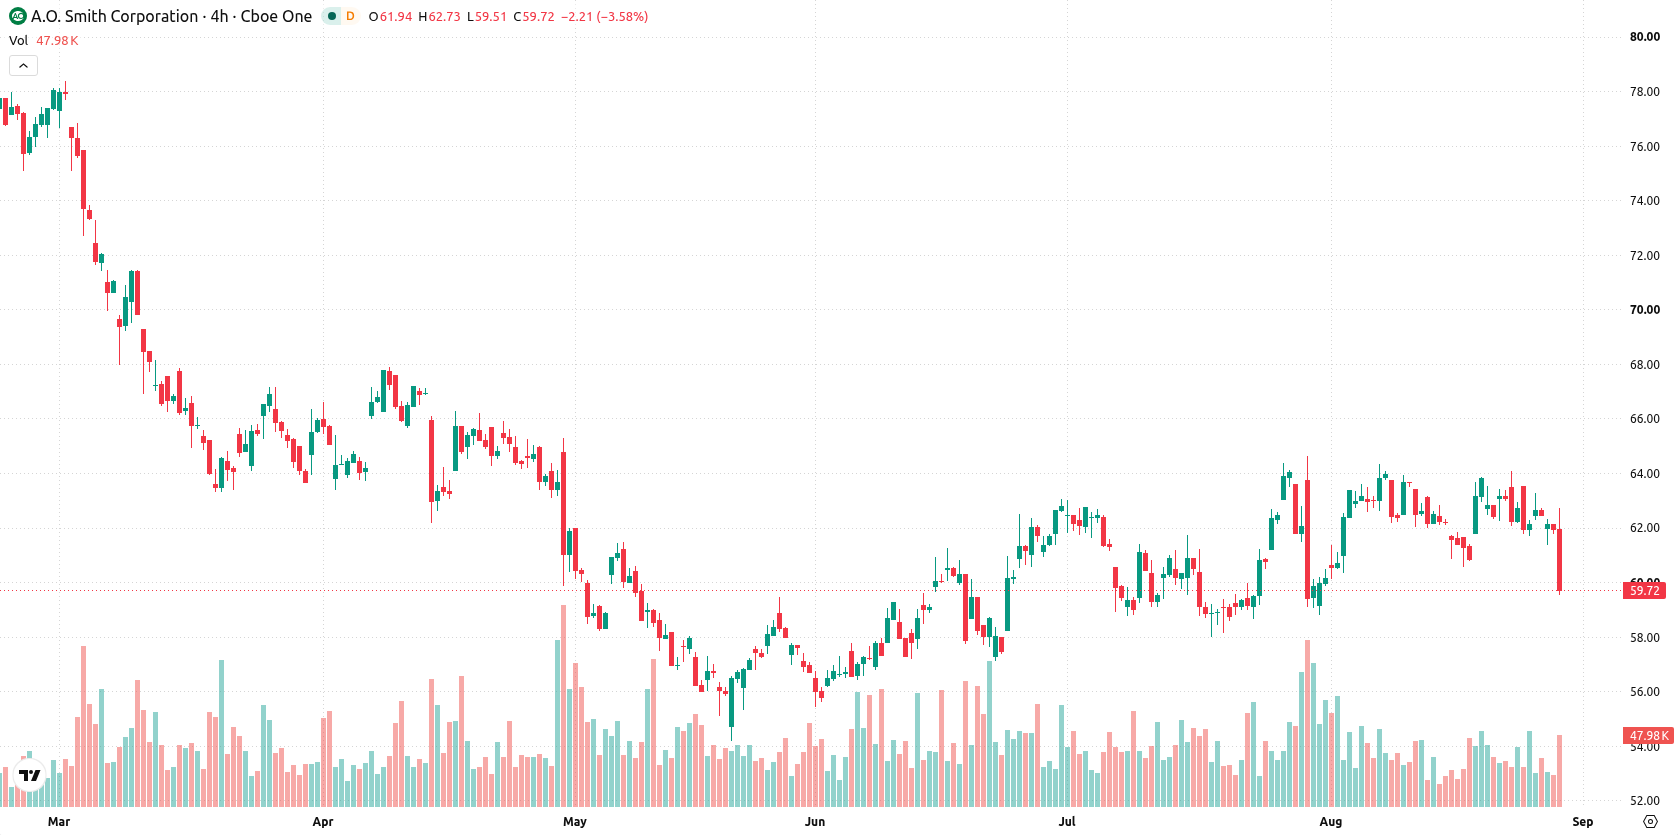
A. O. Smith Corporation (AOS) dropped 3.19% today as technical selling pressure deepened and sellers remained firmly in control across all timeframes. The move is supported by the stock's position below its 20-day, 50-day, and 200-day moving averages, confirming sustained downside bias.
 62.30
62.59
Highlights
- Shares of AO Smith trade below their recent moving averages, signaling continued selling across short, medium, and long-term trends.
- Technical indicators show a mixed picture with strong buy momentum on MACD, but RSI and intraday signals point to persistent selling pressure.
- Over the next five sessions, AO Smith stock is expected to trade between $57.47 and $61.27, with a 63% probability of a downward move.
Seller dominance persists as mixed signals create trend instability
AO Smith is trading below the 20-day ($62.43), 50-day ($61.23), and 200-day ($65.37) moving averages, indicating sellers are driving the short-, medium-, and long-term trends. The nearest resistance is at $61.23 and immediate support is at $59.74, with the Ichimoku Kijun ($61.71) confirming overhead trend resistance and the overall alignment reflecting a bearish long-term bias. Momentum signals are mixed: the Moving Average Convergence Divergence (MACD) points to strong buy momentum, but the Relative Strength Index (RSI) is in sell mode at 49.8, and the Average Directional Index (ADX) remains neutral at 13.73. Bull/Bear Power (BBP) is slightly negative, meaning sellers dominate intraday price action; its oversold reading reflects persistent downside pressure. Commodity Channel Index (CCI) and Stochastic RSI are neutral, while the Awesome Oscillator's direction aligns neutrally with broader price action. The stock has fallen $1.98 or 3.19% today, opening nearly flat and now trading near the session low with volatility at 5.44%. Intraday dynamics point to sustained pressure after the open, and indicator divergence signals an unstable, trendless environment.
Earlier, analysts noted that AO Smith was experiencing mixed technical momentum with long-term resistance weighing on the stock’s outlook. The renewed selling pressure and break below key moving averages in the current session now signal an increased downside risk, making the $59.74 support level a critical threshold to monitor for a potential further decline.






Latest Smith AO Corporation News





-
 Afghanistan
-
 Albania
-
 Algeria
-
 Angola
-
 Argentina
-
 Armenia
-
 Australia
-
 Austria
-
 Azerbaijan
-
 Bahamas
-
 Bahrain
-
 Bangladesh
-
 Belarus
-
 Belgium
-
 Bolivia
-
 Botswana
-
 Brazil
-
 Brunei
-
 Bulgaria
-
 Cambodia
-
 Cameroon
-
 Canada
-
 Chile
-
 China
-
 Colombia
-
 Congo
-
 Costa Rica
-
 Cote d'Ivoire
-
 Croatia
-
 Cuba
-
 Cyprus
-
 Czechia
-
 DR Congo
-
 Denmark
-
 Dominican Republic
-
 Ecuador
-
 Egypt
-
 El Salvador
-
 Estonia
-
 Eswatini
-
 Ethiopia
-
 Finland
-
 France
-
 Georgia
-
 Germany
-
 Ghana
-
 Greece
-
 Haiti
-
 Hong Kong
-
 Hungary
-
 India
-
 Indonesia
-
 Iran, Islamic republic
-
 Iraq
-
 Ireland
-
 Israel
-
 Italy
-
 Jamaica
-
 Japan
-
 Jordan
-
 Kazakhstan
-
 Kenya
-
 Korea
-
 Kuwait
-
 Kyrgyzstan
-
 Laos
-
 Latvia
-
 Lebanon
-
 Lesotho
-
 Libya
-
 Lithuania
-
 Luxembourg
-
 Madagascar
-
 Malaysia
-
 Malta
-
 Mauritius
-
 Mexico
-
 Moldova
-
 Mongolia
-
 Montenegro
-
 Morocco
-
 Mozambique
-
 Myanmar
-
 Namibia
-
 Nepal
-
 Netherlands
-
 New Zealand
-
 Nigeria
-
 North Macedonia
-
 Norway
-
 Oman
-
 Pakistan
-
 Palestine
-
 Panama
-
 Papua New Guinea
-
 Paraguay
-
 Peru
-
 Philippines
-
 Poland
-
 Portugal
-
 Puerto Rico
-
 Qatar
-
 Reunion
-
 Romania
-
 Rwanda
-
 Saudi Arabia
-
 Serbia
-
 Singapore
-
 Slovakia
-
 Slovenia
-
 Somalia
-
 South Africa
-
 Spain
-
 Sri Lanka
-
 Sweden
-
 Switzerland
-
 Syria
-
 Taiwan
-
 Tajikistan
-
 Tanzania
-
 Thailand
-
 Trinidad and Tobago
-
 Tunisia
-
 Turkey
-
 UAE
-
 Uganda
-
 Ukraine
-
 United Kingdom
-
United States
-
 Uruguay
-
 Uzbekistan
-
 Venezuela
-
 Vietnam
-
 Yemen
-
 Zambia
-
 Zimbabwe
- Forex
- Crypto












