

Autodesk stock price prediction: Support pressure after MaintainX integration cost concerns

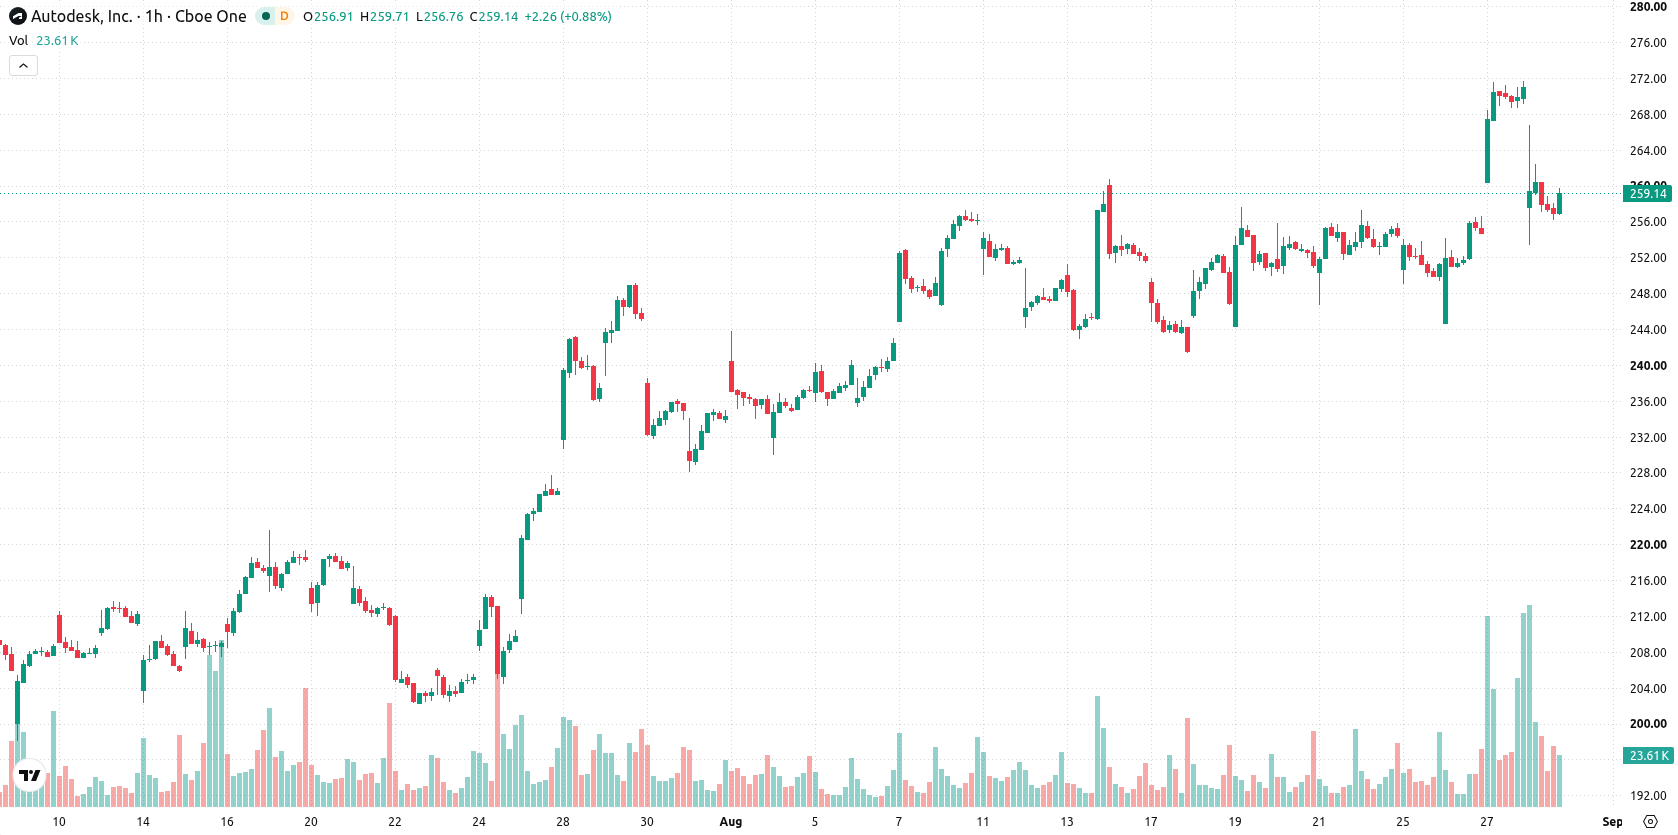
Autodesk (ADSK) stock is trading at $259.03 with a daily move down 4.27%. The price is positioned above its key moving averages, reflecting resilience across both short- and medium-term timeframes.
 267.96
Highlights
- Autodesk reported second quarter earnings of $3.30 per share on revenue of $2.05 billion, exceeding analyst estimates.
- The company now projects full-year revenue of $8.3 to $8.35 billion, with incremental gains expected from the MaintainX acquisition, which will reduce non-GAAP margins short-term due to integration costs.
- Shares of Autodesk are consolidating as technical signals are mixed with high volatility and a next-session trading range forecast of $247.12 to $272.25.
Growth outlook raised as MaintainX deal lifts revenue but weighs on margins
Autodesk reported second quarter fiscal 2027 earnings of $3.30 per share and revenue of $2.05 billion, both surpassing consensus expectations, according to MarketBeat. The company has raised its full-year revenue outlook to a range of $8.3–$8.35 billion, reflecting higher growth projections and initial contributions from the recently closed MaintainX acquisition, as reported by Seeking Alpha. Although this acquisition is expected to incrementally boost revenue, it will dilute Autodesk's non-GAAP margins for the current fiscal year due to integration costs, also noted by Seeking Alpha. These positive operational results and strategic actions were accompanied by continued selling pressure in the market.
Mixed momentum and oversold readings amid persistent volatility
On the technical front, ADSK is trading above the MA-20 ($258.57) and MA-50 ($255.39) on the hourly chart, as well as the MA-200 ($248.64) on the daily timeframe. The Ichimoku Kijun at $258.34 is providing immediate support. Key indicators present a mixed picture: MACD is in Buy mode while ADX is Neutral; RSI sits at 47.6 and signals Sell; Stochastic RSI and Bull/Bear Power are both Oversold, denoting intraday seller control; CCI and Awesome Oscillator are Neutral, showing a lack of clear directional momentum. High volatility persists and price action has left a notable 9.42 point gap lower, with the stock trading in the session's middle range.
Directional breakout risk as consolidation follows balanced probabilities
The short-term forecast for ADSK points to a consolidation phase with a probability-balanced range between $247.12 and $272.25 over the coming sessions. With upward and downward scenarios each carrying 50% probabilities, a decisive break in either direction will depend on whether resistance or immediate support gives way first. The baseline expectation is for continued movement within this volatility band, with price trajectory hinging on the resolution of mixed momentum signals.
Earlier, analysts noted that despite positive earnings and strategic acquisitions, Autodesk shares faced resistance and consolidated under ongoing selling pressure. The current analysis adds nuance with mixed technical signals and volatility, highlighting that a decisive directional move will hinge on which side—support or resistance—breaks first in the coming sessions.











-
 Afghanistan
-
 Albania
-
 Algeria
-
 Angola
-
 Argentina
-
 Armenia
-
 Australia
-
 Austria
-
 Azerbaijan
-
 Bahamas
-
 Bahrain
-
 Bangladesh
-
 Belarus
-
 Belgium
-
 Bolivia
-
 Botswana
-
 Brazil
-
 Brunei
-
 Bulgaria
-
 Cambodia
-
 Cameroon
-
 Canada
-
 Chile
-
 China
-
 Colombia
-
 Congo
-
 Costa Rica
-
 Cote d'Ivoire
-
 Croatia
-
 Cuba
-
 Cyprus
-
 Czechia
-
 DR Congo
-
 Denmark
-
 Dominican Republic
-
 Ecuador
-
 Egypt
-
 El Salvador
-
 Estonia
-
 Eswatini
-
 Ethiopia
-
 Finland
-
 France
-
 Georgia
-
 Germany
-
 Ghana
-
 Greece
-
 Haiti
-
 Hong Kong
-
 Hungary
-
 India
-
 Indonesia
-
 Iran, Islamic republic
-
 Iraq
-
 Ireland
-
 Israel
-
 Italy
-
 Jamaica
-
 Japan
-
 Jordan
-
 Kazakhstan
-
 Kenya
-
 Korea
-
 Kuwait
-
 Kyrgyzstan
-
 Laos
-
 Latvia
-
 Lebanon
-
 Lesotho
-
 Libya
-
 Lithuania
-
 Luxembourg
-
 Madagascar
-
 Malaysia
-
 Malta
-
 Mauritius
-
 Mexico
-
 Moldova
-
 Mongolia
-
 Montenegro
-
 Morocco
-
 Mozambique
-
 Myanmar
-
 Namibia
-
 Nepal
-
 Netherlands
-
 New Zealand
-
 Nigeria
-
 North Macedonia
-
 Norway
-
 Oman
-
 Pakistan
-
 Palestine
-
 Panama
-
 Papua New Guinea
-
 Paraguay
-
 Peru
-
 Philippines
-
 Poland
-
 Portugal
-
 Puerto Rico
-
 Qatar
-
 Reunion
-
 Romania
-
 Rwanda
-
 Saudi Arabia
-
 Serbia
-
 Singapore
-
 Slovakia
-
 Slovenia
-
 Somalia
-
 South Africa
-
 Spain
-
 Sri Lanka
-
 Sweden
-
 Switzerland
-
 Syria
-
 Taiwan
-
 Tajikistan
-
 Tanzania
-
 Thailand
-
 Trinidad and Tobago
-
 Tunisia
-
 Turkey
-
 UAE
-
 Uganda
-
 Ukraine
-
 United Kingdom
-
United States
-
 Uruguay
-
 Uzbekistan
-
 Venezuela
-
 Vietnam
-
 Yemen
-
 Zambia
-
 Zimbabwe
- Forex
- Crypto












