

US legal settlement resolves regulatory risk: META resistance levels in focus

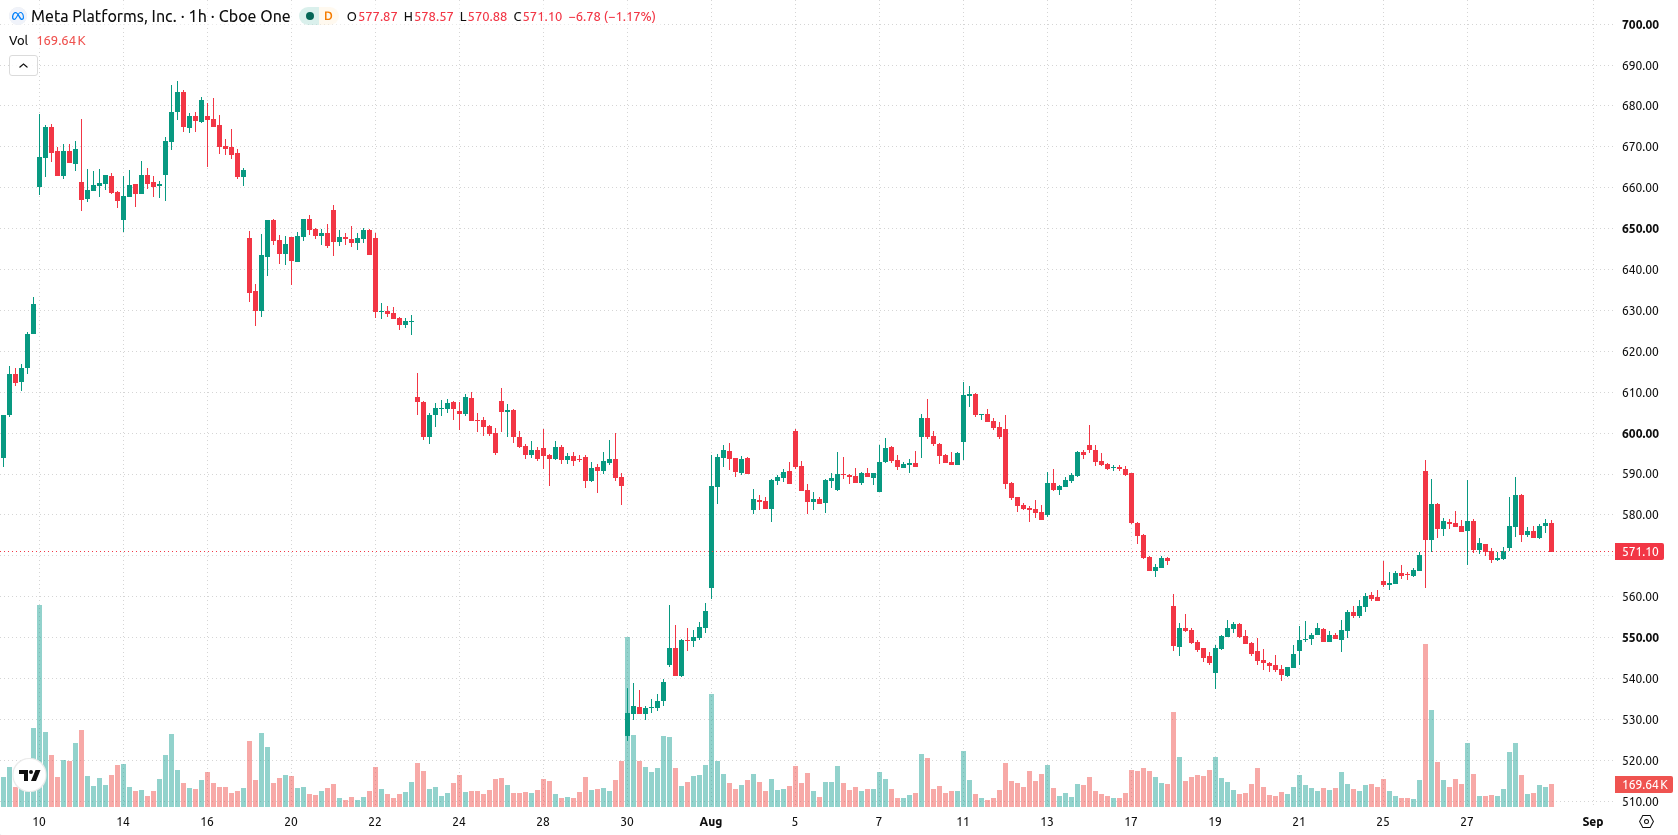
Meta (META) stock is trading at $577.9, up 1.19% on the day. The price sits above its key moving averages in the short term, while still facing resistance from longer-term averages.
 625.28
641.30
Highlights
- Meta Platforms will pay approximately $18 billion to settle US lawsuits claiming Facebook and Instagram harmed minors, reducing future legal risk.
- Meta publicly acknowledged its business model contains elements unsuitable for children, signaling potential operational changes to meet regulatory demands.
- Meta stock is trading in a short-term bullish trend within a $560.61 to $595.19 range, with technical indicators supporting a high probability of upside continuation.
Liability risks abate as $18 billion settlement spurs sentiment rebound
Meta Platforms has agreed to settle lawsuits in the United States for approximately $18 billion over allegations that Facebook and Instagram caused harm to minors, lifting a major regulatory overhang and reducing future liability uncertainty. As part of the agreement, Meta has for the first time acknowledged that significant parts of its business model are unsuitable for children, a step that may encourage operational changes to meet regulatory expectations and restore public trust. Additionally, an updated login with Facebook process was introduced to simplify returning logins and enhance user convenience for eligible users. These developments collectively serve to diminish legal risks and improve sentiment around the stock.
Diverging trend strength as bullish momentum clashes with mixed signals
On the technical front, META trades above the MA-20 and MA-50 on the H1 chart, while remaining below the longer-term MA-200. Immediate support can be found at the Ichimoku Kijun level of $576.15. MACD and ADX highlight strong bullish momentum intraday, while RSI prints at 57.91, indicating a mild buy bias. CCI and Stochastic RSI remain neutral, and Bull/Bear Power is overbought, showing pronounced buying pressure in the session. Awesome Oscillator is neutral, leading to signals of divergence between trend indicators and momentum oscillators, with intraday price performance hinting at some underlying weakness despite earlier strength.
Bullish range favored as breakout scenarios track shifting volatility
In the short term, META is expected to trade within a range of $560.61 to $595.19, in line with typical volatility at current levels. The probability of further upside remains very high, while downside risks are minimal. Stable consolidation inside this corridor is the baseline scenario; a breakout above $595.19 would suggest renewed bullish continuation, while a move below $560.61 would indicate a shift in sentiment to the downside.
Previously it was reported that Meta's resolution of major legal claims cleared a significant regulatory hurdle while leaving the company within a broader technical downtrend. The current analysis strengthens this view with improved technical positioning and reduced legal uncertainty, highlighting the $595.19 level as a key threshold for renewed bullish momentum.











-
 Afghanistan
-
 Albania
-
 Algeria
-
 Angola
-
 Argentina
-
 Armenia
-
 Australia
-
 Austria
-
 Azerbaijan
-
 Bahamas
-
 Bahrain
-
 Bangladesh
-
 Belarus
-
 Belgium
-
 Bolivia
-
 Botswana
-
 Brazil
-
 Brunei
-
 Bulgaria
-
 Cambodia
-
 Cameroon
-
 Canada
-
 Chile
-
 China
-
 Colombia
-
 Congo
-
 Costa Rica
-
 Cote d'Ivoire
-
 Croatia
-
 Cuba
-
 Cyprus
-
 Czechia
-
 DR Congo
-
 Denmark
-
 Dominican Republic
-
 Ecuador
-
 Egypt
-
 El Salvador
-
 Estonia
-
 Eswatini
-
 Ethiopia
-
 Finland
-
 France
-
 Georgia
-
 Germany
-
 Ghana
-
 Greece
-
 Haiti
-
 Hong Kong
-
 Hungary
-
 India
-
 Indonesia
-
 Iran, Islamic republic
-
 Iraq
-
 Ireland
-
 Israel
-
 Italy
-
 Jamaica
-
 Japan
-
 Jordan
-
 Kazakhstan
-
 Kenya
-
 Korea
-
 Kuwait
-
 Kyrgyzstan
-
 Laos
-
 Latvia
-
 Lebanon
-
 Lesotho
-
 Libya
-
 Lithuania
-
 Luxembourg
-
 Madagascar
-
 Malaysia
-
 Malta
-
 Mauritius
-
 Mexico
-
 Moldova
-
 Mongolia
-
 Montenegro
-
 Morocco
-
 Mozambique
-
 Myanmar
-
 Namibia
-
 Nepal
-
 Netherlands
-
 New Zealand
-
 Nigeria
-
 North Macedonia
-
 Norway
-
 Oman
-
 Pakistan
-
 Palestine
-
 Panama
-
 Papua New Guinea
-
 Paraguay
-
 Peru
-
 Philippines
-
 Poland
-
 Portugal
-
 Puerto Rico
-
 Qatar
-
 Reunion
-
 Romania
-
 Rwanda
-
 Saudi Arabia
-
 Serbia
-
 Singapore
-
 Slovakia
-
 Slovenia
-
 Somalia
-
 South Africa
-
 Spain
-
 Sri Lanka
-
 Sweden
-
 Switzerland
-
 Syria
-
 Taiwan
-
 Tajikistan
-
 Tanzania
-
 Thailand
-
 Trinidad and Tobago
-
 Tunisia
-
 Turkey
-
 UAE
-
 Uganda
-
 Ukraine
-
 United Kingdom
-
United States
-
 Uruguay
-
 Uzbekistan
-
 Venezuela
-
 Vietnam
-
 Yemen
-
 Zambia
-
 Zimbabwe
- Forex
- Crypto












