

Visa stock weekly forecast: RSI approaches overbought territory with bullish structure intact

Shares of Visa Inc. (V) are trading near $381 as a sustained rally now runs into overbought technical signals, with buyers showing ongoing strength but momentum beginning to fade. The setup for the coming week centers on whether upside momentum can persist or if recent exhaustion will lead to a pause.
 404.16
Highlights
- Shares of Visa trade at $380.7, holding slightly lower over 7 days within a 1.79% volatility range.
- The stock stays above its main moving averages, indicating a sustained bullish long-term trend structure.
- Technical signals show near-term upside exhaustion and possible consolidation between $377.66 and $386.11, with $378.68 as key support and $385.46 as resistance.
Investor confidence climbs following earnings beat and bullish news
Visa reported robust quarterly earnings for the period ended June 30, 2026, showing 17% revenue growth and a 20% year-over-year increase in earnings per share, exceeding Wall Street forecasts, according to Yahoo Finance and MoneyCheck. The company raised its full-year outlook, unveiled a $20 billion share buyback program, and announced a quarterly dividend of $0.67 per share payable September 1, moves that emboldened institutional investors to increase their positions in V. Additional headlines included CEO Ryan McInerney's insider sale of 5,875 shares on August 21 and the announcement of a new partnership with Dunamu to develop stablecoin payment and AI-based infrastructure solutions.
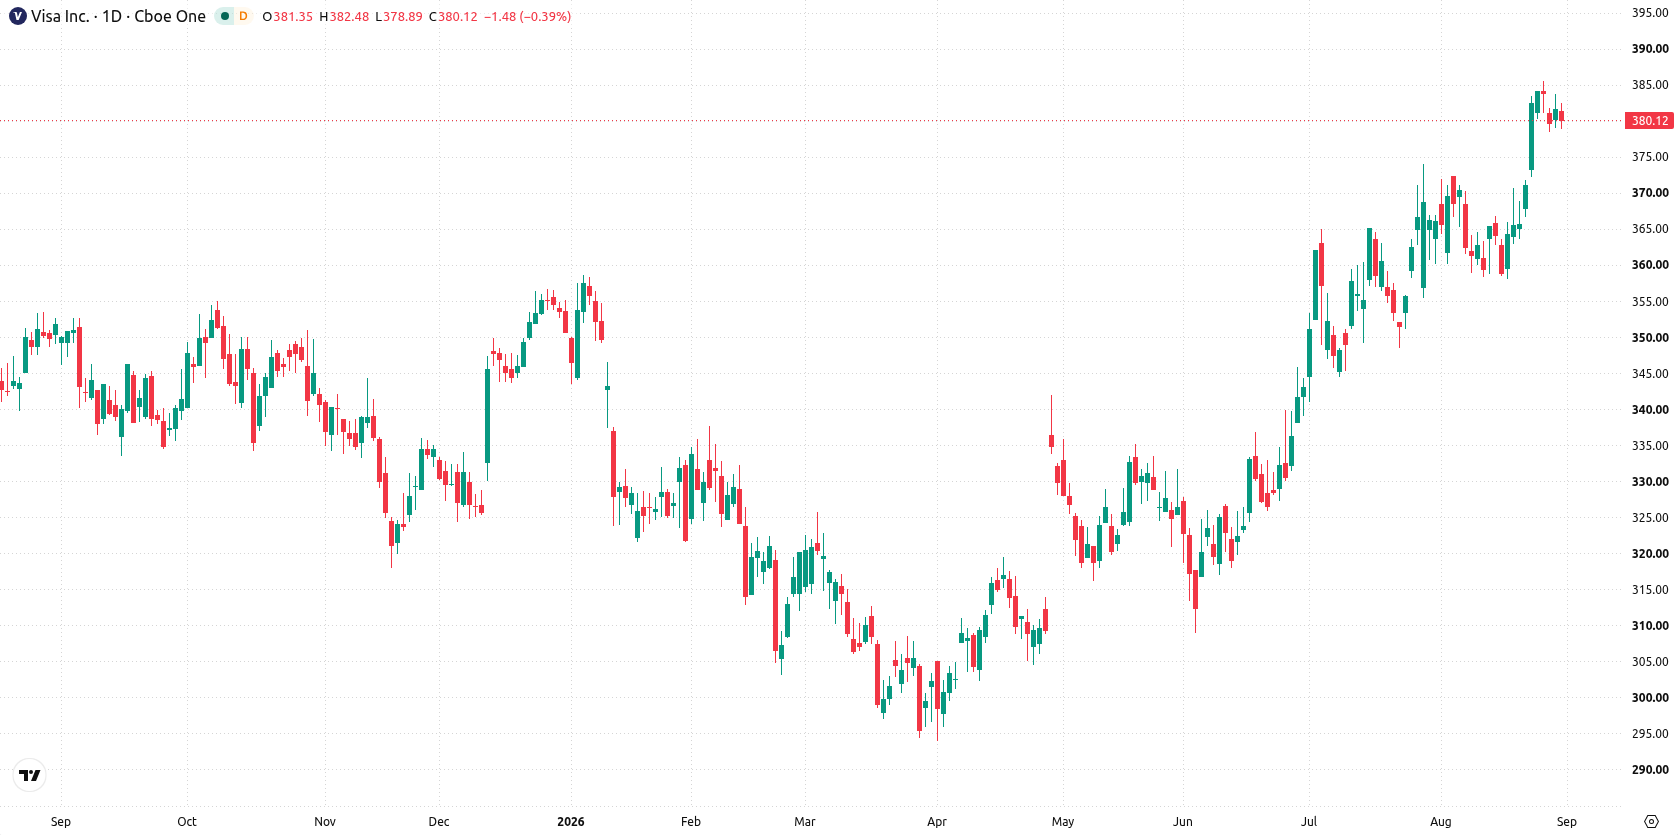
Overbought technicals and conflicting momentum shape weekly outlook
The daily chart reveals a structure where price action is above the main moving averages with developing trend strength, while momentum is marked by an emerging move lower that is not yet confirmed. RSI is at 66 and approaching overbought, and CCI is reading 132.41, indicating an overbought zone—together these signal growing upside exhaustion. The nearest support sits at $378.68, while the nearest resistance is at $385.46, with the Ichimoku Kijun at $369.05 acting as an additional support reference. This setup points to near-term hesitation as momentum signals begin to conflict with the underlying bullish structure.
Upside bias persists as range-bound trade and resistance trigger loom
In the week ahead, the expected range is $377.66 to $386.11. There is a very high probability of an increase and a very low chance of a decrease. The base case calls for consolidation within this range, with buyers likely to dominate as long as support at $378.68 holds. A break above $385.46 would open the way for further gains, while a move below support could shift momentum to the downside.
Earlier, analysts noted that Visa stood out as a high-quality, resilient equity benefiting from strong fundamentals and diversified business lines during periods of market uncertainty. The current technical and fundamental setup adds a new dimension, with elevated overbought signals highlighting $385.46 as a critical resistance level for traders to monitor in the coming sessions.





Latest Visa News





-
 Afghanistan
-
 Albania
-
 Algeria
-
 Angola
-
 Argentina
-
 Armenia
-
 Australia
-
 Austria
-
 Azerbaijan
-
 Bahamas
-
 Bahrain
-
 Bangladesh
-
 Belarus
-
 Belgium
-
 Bolivia
-
 Botswana
-
 Brazil
-
 Brunei
-
 Bulgaria
-
 Cambodia
-
 Cameroon
-
 Canada
-
 Chile
-
 China
-
 Colombia
-
 Congo
-
 Costa Rica
-
 Cote d'Ivoire
-
 Croatia
-
 Cuba
-
 Cyprus
-
 Czechia
-
 DR Congo
-
 Denmark
-
 Dominican Republic
-
 Ecuador
-
 Egypt
-
 El Salvador
-
 Estonia
-
 Eswatini
-
 Ethiopia
-
 Finland
-
 France
-
 Georgia
-
 Germany
-
 Ghana
-
 Greece
-
 Haiti
-
 Hong Kong
-
 Hungary
-
 India
-
 Indonesia
-
 Iran, Islamic republic
-
 Iraq
-
 Ireland
-
 Israel
-
 Italy
-
 Jamaica
-
 Japan
-
 Jordan
-
 Kazakhstan
-
 Kenya
-
 Korea
-
 Kuwait
-
 Kyrgyzstan
-
 Laos
-
 Latvia
-
 Lebanon
-
 Lesotho
-
 Libya
-
 Lithuania
-
 Luxembourg
-
 Madagascar
-
 Malaysia
-
 Malta
-
 Mauritius
-
 Mexico
-
 Moldova
-
 Mongolia
-
 Montenegro
-
 Morocco
-
 Mozambique
-
 Myanmar
-
 Namibia
-
 Nepal
-
 Netherlands
-
 New Zealand
-
 Nigeria
-
 North Macedonia
-
 Norway
-
 Oman
-
 Pakistan
-
 Palestine
-
 Panama
-
 Papua New Guinea
-
 Paraguay
-
 Peru
-
 Philippines
-
 Poland
-
 Portugal
-
 Puerto Rico
-
 Qatar
-
 Reunion
-
 Romania
-
 Rwanda
-
 Saudi Arabia
-
 Serbia
-
 Singapore
-
 Slovakia
-
 Slovenia
-
 Somalia
-
 South Africa
-
 Spain
-
 Sri Lanka
-
 Sweden
-
 Switzerland
-
 Syria
-
 Taiwan
-
 Tajikistan
-
 Tanzania
-
 Thailand
-
 Trinidad and Tobago
-
 Tunisia
-
 Turkey
-
 UAE
-
 Uganda
-
 Ukraine
-
 United Kingdom
-
United States
-
 Uruguay
-
 Uzbekistan
-
 Venezuela
-
 Vietnam
-
 Yemen
-
 Zambia
-
 Zimbabwe
- Forex
- Crypto












