

What's behind Abbott Laboratories's latest stock pullback?

Abbott Laboratories (ABT) fell 1.73% after renewed selling pressure, even as recent institutional investment and a positive earnings report provided a constructive backdrop. The move faces limits, with the stock slipping below its 20-day moving average and short-term technical signals showing mixed momentum amid a medium- and long-term bullish structure.
 111.61
116.99
Highlights
- Ieq Capital LLC acquired 191,459 shares of Abbott Laboratories in the second quarter, investing $17.37 million.
- Abbott Laboratories declared a quarterly dividend of $0.63 per share, producing a 2.2% annualized yield.
- Shares of Abbott Laboratories are trading near $110.51, with mixed momentum signals and an expected range of $107.81 to $113.21 over five days.
Institutional buying and earnings beat fail to counter broad selling
Ieq Capital LLC acquired a new position in Abbott Laboratories during the second quarter, purchasing approximately 191,459 shares valued at $17.37 million. The company also paid a quarterly dividend of $0.63 per share on August 17, 2023, giving an annualized yield of 2.2%. In the same period, OneAscent Financial Services LLC invested $544,000, acquiring 5,996 shares. Abbott Laboratories reported quarterly earnings per share of $1.31, exceeding consensus estimates, though price action has remained under broader selling pressure.
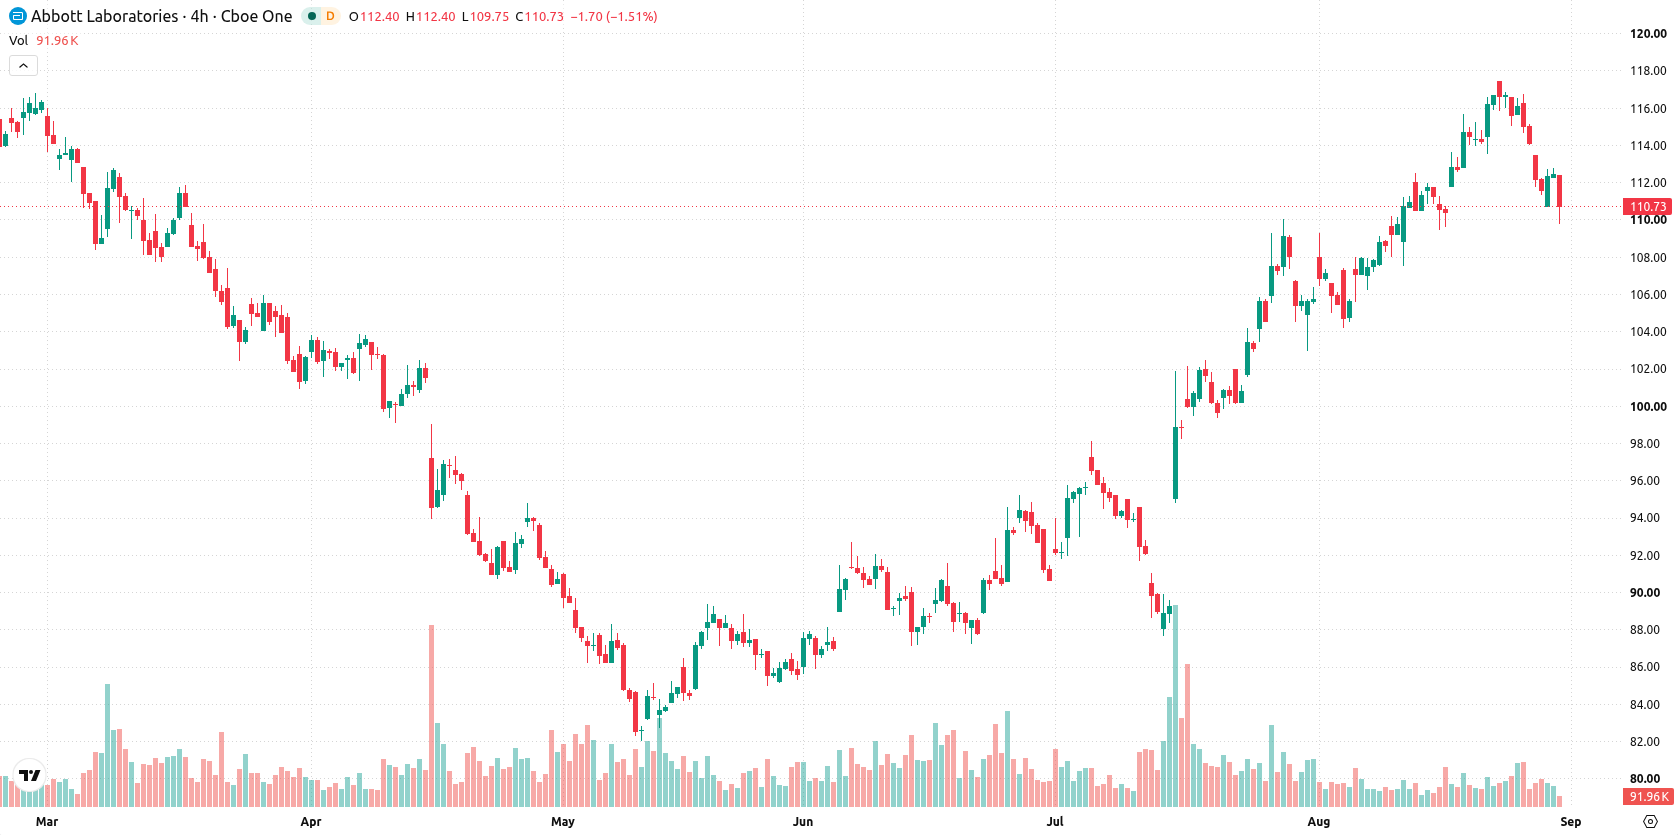
Mixed momentum signals as price tests major averages and support levels
Abbott Laboratories is trading below its 20-day moving average at $111.25, but remains above both the 50-day at $102.44 and the 200-day at $106.8, suggesting short-term downward pressure with a medium- and long-term bullish outlook. The nearest resistance is the ceiling at $111.18, while support is found at $109.87. The prevailing MA-50 versus MA-200 bearish alignment signals caution for longer-term positions. Momentum is mixed: the MACD and ADX both indicate strengthening upward momentum, while the RSI is in a neutral-to-bullish zone with a buy signal. The Stochastic RSI and Bull/Bear Power both indicate oversold conditions, though the BBP remains slightly positive, showing buyers still dominate intraday action. The Awesome Oscillator and Commodity Channel Index are neutral. Price action is near the session low, daily volatility is firm at 2.03%, and intraday tone reflects renewed pressure after the open. Divergence is apparent in the short-term signals.
Earlier, analysts noted that Abbott Laboratories maintained a bullish long-term structure despite near-term consolidation risks. The current technical setup reinforces this view, with mixed short-term signals but an ongoing upward probability, making the $111.18 resistance a pivotal level to monitor for potential breakout.









-
 Afghanistan
-
 Albania
-
 Algeria
-
 Angola
-
 Argentina
-
 Armenia
-
 Australia
-
 Austria
-
 Azerbaijan
-
 Bahamas
-
 Bahrain
-
 Bangladesh
-
 Belarus
-
 Belgium
-
 Bolivia
-
 Botswana
-
 Brazil
-
 Brunei
-
 Bulgaria
-
 Cambodia
-
 Cameroon
-
 Canada
-
 Chile
-
 China
-
 Colombia
-
 Congo
-
 Costa Rica
-
 Cote d'Ivoire
-
 Croatia
-
 Cuba
-
 Cyprus
-
 Czechia
-
 DR Congo
-
 Denmark
-
 Dominican Republic
-
 Ecuador
-
 Egypt
-
 El Salvador
-
 Estonia
-
 Eswatini
-
 Ethiopia
-
 Finland
-
 France
-
 Georgia
-
 Germany
-
 Ghana
-
 Greece
-
 Haiti
-
 Hong Kong
-
 Hungary
-
 India
-
 Indonesia
-
 Iran, Islamic republic
-
 Iraq
-
 Ireland
-
 Israel
-
 Italy
-
 Jamaica
-
 Japan
-
 Jordan
-
 Kazakhstan
-
 Kenya
-
 Korea
-
 Kuwait
-
 Kyrgyzstan
-
 Laos
-
 Latvia
-
 Lebanon
-
 Lesotho
-
 Libya
-
 Lithuania
-
 Luxembourg
-
 Madagascar
-
 Malaysia
-
 Malta
-
 Mauritius
-
 Mexico
-
 Moldova
-
 Mongolia
-
 Montenegro
-
 Morocco
-
 Mozambique
-
 Myanmar
-
 Namibia
-
 Nepal
-
 Netherlands
-
 New Zealand
-
 Nigeria
-
 North Macedonia
-
 Norway
-
 Oman
-
 Pakistan
-
 Palestine
-
 Panama
-
 Papua New Guinea
-
 Paraguay
-
 Peru
-
 Philippines
-
 Poland
-
 Portugal
-
 Puerto Rico
-
 Qatar
-
 Reunion
-
 Romania
-
 Rwanda
-
 Saudi Arabia
-
 Serbia
-
 Singapore
-
 Slovakia
-
 Slovenia
-
 Somalia
-
 South Africa
-
 Spain
-
 Sri Lanka
-
 Sweden
-
 Switzerland
-
 Syria
-
 Taiwan
-
 Tajikistan
-
 Tanzania
-
 Thailand
-
 Trinidad and Tobago
-
 Tunisia
-
 Turkey
-
 UAE
-
 Uganda
-
 Ukraine
-
 United Kingdom
-
United States
-
 Uruguay
-
 Uzbekistan
-
 Venezuela
-
 Vietnam
-
 Yemen
-
 Zambia
-
 Zimbabwe
- Forex
- Crypto












