

Inclusion in MANGOS Plus Index ETF FRUT: Can AMD stock break $473.93 resistance?

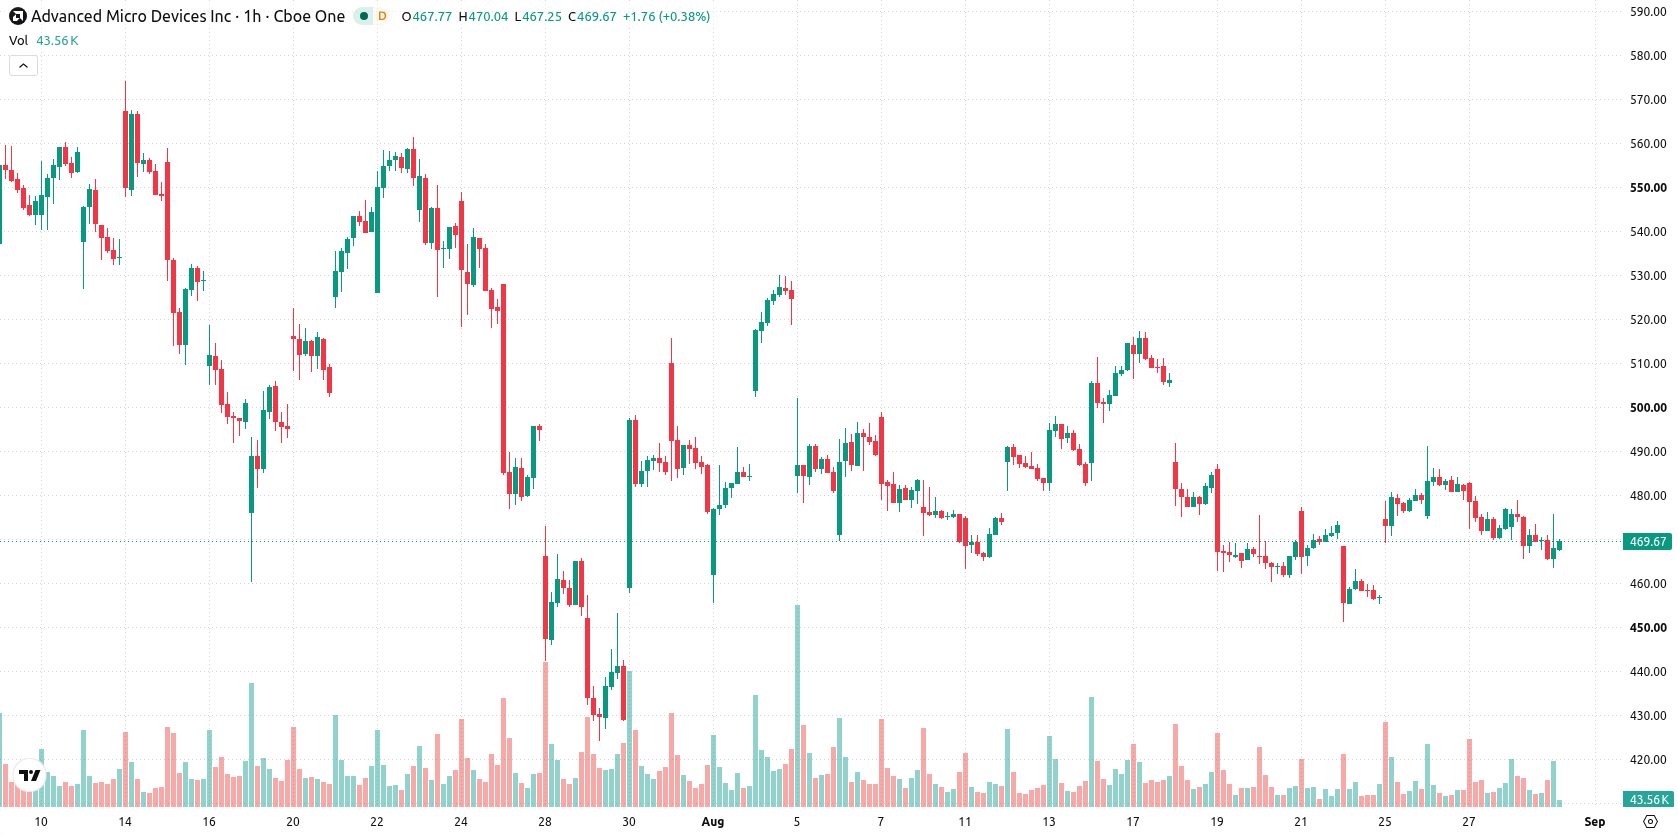
Advanced Micro Devices, Inc. (AMD) stock is trading at $469.07 after a marginal upward move on the day. The price sits below its key moving averages, reflecting moderate short-term pressure in a generally volatile session.
 497.40
578.75
Highlights
- The inclusion of AMD in the MANGOS Plus Index ETF expands passive flows into AMD shares as ETF allocations broaden the shareholder base.
- The ETF's focus on AI infrastructure may support sustained portfolio flows to AMD, positioning it within the thematic 'Parabolic 7' group.
- Shares of AMD face short-term downside pressure with most indicators showing seller dominance and are expected to trade between $457.01 and $480.32 in coming sessions.
ETF-driven inflows grow as index inclusion boosts AMD demand
Yorkville America's launch of the MANGOS Plus Index ETF (FRUT) has led to the inclusion of AMD as part of its 'Parabolic 7' group, according to Aijourn. This development increases passive demand for AMD shares through new index-tracking inflows, as ETF allocations mechanically broaden the shareholder base. Thematic focus on AI infrastructure within the ETF composition could further shape long-term portfolio flows toward AMD.
Sustained downside momentum as sellers dominate technical signals
On the hourly chart, AMD is trading below the MA-20 at $475.09 and the MA-50 at $471.5, with price action remaining above the long-term MA-200 at $335.52. The Ichimoku Kijun stands at $473.93, acting as nearby resistance, while primary support is identified at $457.01. Momentum indicators show persistent weakness: MACD signals Sell, ADX is Neutral, and the Awesome Oscillator favors sellers. RSI at 39.15, together with Stochastic RSI, CCI, and Bull/Bear Power, all point toward oversold or seller-dominant conditions, aligning with the observed intraday downside pressure and lack of bullish divergence among oscillators.
Range-bound consolidation expected as downside breakout risk rises
Looking ahead, AMD is expected to consolidate within a range of $457.01 to $480.32 in the next few sessions. The probability of an upward breakout is very low, while a downward move is much more likely according to scenario probabilities. Should prices overcome the $473.93 resistance, a bullish breakout may develop, while a drop below $457.01 would open potential for deeper corrective action. The baseline scenario anticipates continued range-bound movement within this volatility band.
Earlier, analysts noted that AMD faced ongoing technical pressures despite continued demand for its AI and data center products. The current context, marked by ETF-driven passive inflows and persistent downside signals from momentum indicators, raises the importance of monitoring the $457.01 support as a key level for any potential shift in near-term price action.






Latest AMD News





-
 Afghanistan
-
 Albania
-
 Algeria
-
 Angola
-
 Argentina
-
 Armenia
-
 Australia
-
 Austria
-
 Azerbaijan
-
 Bahamas
-
 Bahrain
-
 Bangladesh
-
 Belarus
-
 Belgium
-
 Bolivia
-
 Botswana
-
 Brazil
-
 Brunei
-
 Bulgaria
-
 Cambodia
-
 Cameroon
-
 Canada
-
 Chile
-
 China
-
 Colombia
-
 Congo
-
 Costa Rica
-
 Cote d'Ivoire
-
 Croatia
-
 Cuba
-
 Cyprus
-
 Czechia
-
 DR Congo
-
 Denmark
-
 Dominican Republic
-
 Ecuador
-
 Egypt
-
 El Salvador
-
 Estonia
-
 Eswatini
-
 Ethiopia
-
 Finland
-
 France
-
 Georgia
-
 Germany
-
 Ghana
-
 Greece
-
 Haiti
-
 Hong Kong
-
 Hungary
-
 India
-
 Indonesia
-
 Iran, Islamic republic
-
 Iraq
-
 Ireland
-
 Israel
-
 Italy
-
 Jamaica
-
 Japan
-
 Jordan
-
 Kazakhstan
-
 Kenya
-
 Korea
-
 Kuwait
-
 Kyrgyzstan
-
 Laos
-
 Latvia
-
 Lebanon
-
 Lesotho
-
 Libya
-
 Lithuania
-
 Luxembourg
-
 Madagascar
-
 Malaysia
-
 Malta
-
 Mauritius
-
 Mexico
-
 Moldova
-
 Mongolia
-
 Montenegro
-
 Morocco
-
 Mozambique
-
 Myanmar
-
 Namibia
-
 Nepal
-
 Netherlands
-
 New Zealand
-
 Nigeria
-
 North Macedonia
-
 Norway
-
 Oman
-
 Pakistan
-
 Palestine
-
 Panama
-
 Papua New Guinea
-
 Paraguay
-
 Peru
-
 Philippines
-
 Poland
-
 Portugal
-
 Puerto Rico
-
 Qatar
-
 Reunion
-
 Romania
-
 Rwanda
-
 Saudi Arabia
-
 Serbia
-
 Singapore
-
 Slovakia
-
 Slovenia
-
 Somalia
-
 South Africa
-
 Spain
-
 Sri Lanka
-
 Sweden
-
 Switzerland
-
 Syria
-
 Taiwan
-
 Tajikistan
-
 Tanzania
-
 Thailand
-
 Trinidad and Tobago
-
 Tunisia
-
 Turkey
-
 UAE
-
 Uganda
-
 Ukraine
-
 United Kingdom
-
United States
-
 Uruguay
-
 Uzbekistan
-
 Venezuela
-
 Vietnam
-
 Yemen
-
 Zambia
-
 Zimbabwe
- Forex
- Crypto












