

Xerox shares rise over 5% as bullish technical momentum drives gains

Xerox Corporation (XRX) climbed 5.24% driven by sustained bullish technical momentum and ongoing buying interest, with no fresh catalysts emerging to explain today's move. The advance is clearly supported by the stock trading above its major moving averages, confirming positive sentiment across short, medium, and long-term trends.
 0.9657
1.13
Highlights
- Xerox stock is trading above key moving averages, indicating bullish momentum across short-, medium-, and long-term trends.
- Technical indicators are mixed, but overall bias favors continued buying interest with buyers showing dominance in current trading.
- Expected five-day trading range is $3.02 to $3.42, with strong probability of upward or sideways movement barring a drop below $3.19.
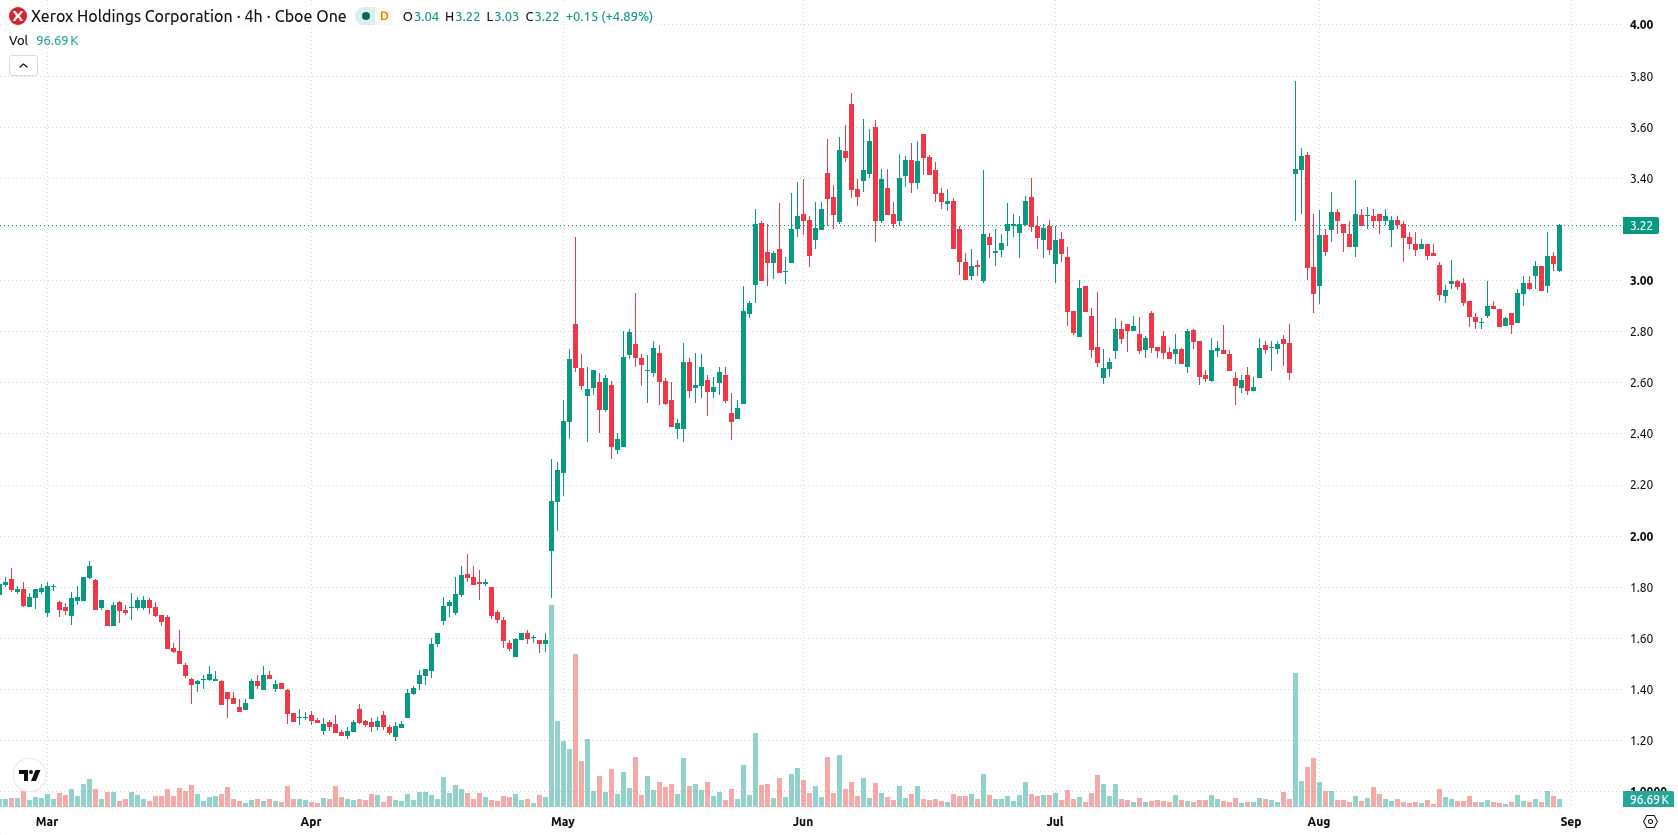
Mixed indicators limit conviction as price tests resistance band
Xerox is currently trading above its 20-day, 50-day, and 200-day moving averages ($3.06, $2.95, and $2.45), indicating bullish momentum across short-, medium-, and long-term trends. The Ichimoku Kijun at $3.17 serves as a support level, with the near-term ceiling at $3.42 and the near-term floor at $3.19 providing reference levels for immediate price action. Momentum readings are mixed: both the MACD and Average Directional Index (ADX) are neutral, indicating the absence of a strong directional push. The Relative Strength Index (RSI) at 53.72 issues a buy forecast, while the Stochastic RSI at 76.11 and Commodity Channel Index (CCI) at 4.42 remain neutral. Bull/Bear Power (BBP) at 0.22 signals clear dominance by buyers, forecasting a strong buy, and the Awesome Oscillator (AO) also favors continued buying interest. Today, the stock is up $0.16 or 5.24%, opening with a small upside gap of $0.01 (0.33%), and is trading near the high of its daily range with intraday volatility at 2.97%. The price action shows continued strength toward session highs, aligning with the positive intraday momentum.
Earlier, analysts noted that Xerox’s short- and medium-term selling pressure persisted even as the stock showed brief rallies, leaving its long-term trend unresolved. The current technical profile, which now reflects bullish momentum across all major timeframes, highlights $3.42 as the primary resistance and the level to watch for a confirmed breakout in the coming sessions.






Latest Xerox News



-
 Afghanistan
-
 Albania
-
 Algeria
-
 Angola
-
 Argentina
-
 Armenia
-
 Australia
-
 Austria
-
 Azerbaijan
-
 Bahamas
-
 Bahrain
-
 Bangladesh
-
 Belarus
-
 Belgium
-
 Bolivia
-
 Botswana
-
 Brazil
-
 Brunei
-
 Bulgaria
-
 Cambodia
-
 Cameroon
-
 Canada
-
 Chile
-
 China
-
 Colombia
-
 Congo
-
 Costa Rica
-
 Cote d'Ivoire
-
 Croatia
-
 Cuba
-
 Cyprus
-
 Czechia
-
 DR Congo
-
 Denmark
-
 Dominican Republic
-
 Ecuador
-
 Egypt
-
 El Salvador
-
 Estonia
-
 Eswatini
-
 Ethiopia
-
 Finland
-
 France
-
 Georgia
-
 Germany
-
 Ghana
-
 Greece
-
 Haiti
-
 Hong Kong
-
 Hungary
-
 India
-
 Indonesia
-
 Iran, Islamic republic
-
 Iraq
-
 Ireland
-
 Israel
-
 Italy
-
 Jamaica
-
 Japan
-
 Jordan
-
 Kazakhstan
-
 Kenya
-
 Korea
-
 Kuwait
-
 Kyrgyzstan
-
 Laos
-
 Latvia
-
 Lebanon
-
 Lesotho
-
 Libya
-
 Lithuania
-
 Luxembourg
-
 Madagascar
-
 Malaysia
-
 Malta
-
 Mauritius
-
 Mexico
-
 Moldova
-
 Mongolia
-
 Montenegro
-
 Morocco
-
 Mozambique
-
 Myanmar
-
 Namibia
-
 Nepal
-
 Netherlands
-
 New Zealand
-
 Nigeria
-
 North Macedonia
-
 Norway
-
 Oman
-
 Pakistan
-
 Palestine
-
 Panama
-
 Papua New Guinea
-
 Paraguay
-
 Peru
-
 Philippines
-
 Poland
-
 Portugal
-
 Puerto Rico
-
 Qatar
-
 Reunion
-
 Romania
-
 Rwanda
-
 Saudi Arabia
-
 Serbia
-
 Singapore
-
 Slovakia
-
 Slovenia
-
 Somalia
-
 South Africa
-
 Spain
-
 Sri Lanka
-
 Sweden
-
 Switzerland
-
 Syria
-
 Taiwan
-
 Tajikistan
-
 Tanzania
-
 Thailand
-
 Trinidad and Tobago
-
 Tunisia
-
 Turkey
-
 UAE
-
 Uganda
-
 Ukraine
-
 United Kingdom
-
United States
-
 Uruguay
-
 Uzbekistan
-
 Venezuela
-
 Vietnam
-
 Yemen
-
 Zambia
-
 Zimbabwe
- Forex
- Crypto












