

Why is Edison International stock down 24% today?

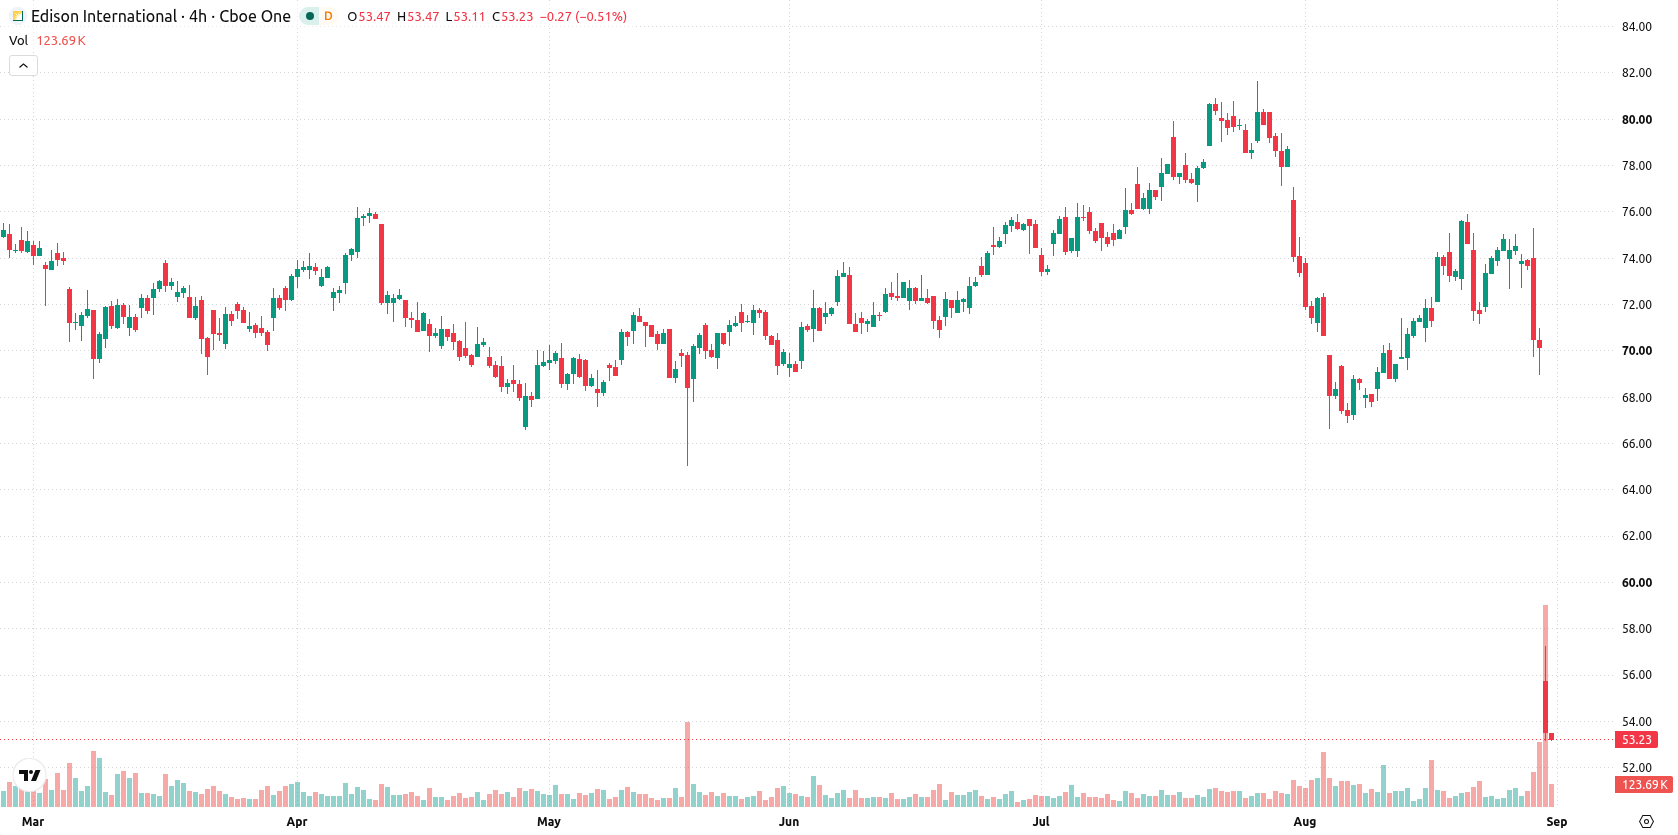
Edison International (EIX) fell 24.02% as persistent bearish momentum and decisive breaks below all major moving averages drove the decline in the absence of any fresh company news. The scale and alignment of technical factors strongly support the move, with continued downside pressure evident across all time frames.
 60.42
62.36
Highlights
- Shares of Edison International have fallen 24.02% to $53.3, decisively breaching short- and long-term moving averages.
- Technical indicators show strong downward momentum and broad selling, with no confirmed short-term trend reversal.
- The stock is forecast to trade between $35.24 and $56.25 over the next five sessions, with an over 80% probability of continued downside.
Downside risks persist as support nears and momentum indicators diverge
EIX is trading at $53.3, decisively below its 20-day, 50-day, and 200-day moving averages ($71.37, $74.25, and $68.54), clearly signaling strong downward pressure across short-, medium-, and long-term trends. The closest resistance level is at $53.81, while the closest major support is forecast at $35.24. The broader trend context is technically bullish due to the alignment between the 50-day and 200-day moving averages, but momentum signals are predominately negative. The MACD indicates strong downside momentum, with the ADX neutral and no clear trend strength confirmed. RSI stands at 42.01, tilting towards sell, and both Stochastic RSI and CCI are neutral. Bull/Bear Power at 2.58 suggests some intraday buyer presence, but this is flagged as overbought. The Awesome Oscillator supports the downward trend with a sell forecast. Intraday, the stock dropped sharply, down $16.85 (24.02%) from the previous close, opening with a marked downside gap of $14.44 (20.58%) and holding near session lows with volatile price swings (intraday volatility amplitude at 6.36%). Persistent pressure after the open matches the dominant bearish momentum signals.
Earlier, analysts noted that Edison International was already facing heightened downside risk amid prevailing bearish momentum and technical consolidation. The current analysis builds on this outlook by highlighting sustained technical weakness and an elevated probability of further declines, with $35.24 emerging as the key support level to monitor in the near term.






Latest Edison International News



-
 Afghanistan
-
 Albania
-
 Algeria
-
 Angola
-
 Argentina
-
 Armenia
-
 Australia
-
 Austria
-
 Azerbaijan
-
 Bahamas
-
 Bahrain
-
 Bangladesh
-
 Belarus
-
 Belgium
-
 Bolivia
-
 Botswana
-
 Brazil
-
 Brunei
-
 Bulgaria
-
 Cambodia
-
 Cameroon
-
 Canada
-
 Chile
-
 China
-
 Colombia
-
 Congo
-
 Costa Rica
-
 Cote d'Ivoire
-
 Croatia
-
 Cuba
-
 Cyprus
-
 Czechia
-
 DR Congo
-
 Denmark
-
 Dominican Republic
-
 Ecuador
-
 Egypt
-
 El Salvador
-
 Estonia
-
 Eswatini
-
 Ethiopia
-
 Finland
-
 France
-
 Georgia
-
 Germany
-
 Ghana
-
 Greece
-
 Haiti
-
 Hong Kong
-
 Hungary
-
 India
-
 Indonesia
-
 Iran, Islamic republic
-
 Iraq
-
 Ireland
-
 Israel
-
 Italy
-
 Jamaica
-
 Japan
-
 Jordan
-
 Kazakhstan
-
 Kenya
-
 Korea
-
 Kuwait
-
 Kyrgyzstan
-
 Laos
-
 Latvia
-
 Lebanon
-
 Lesotho
-
 Libya
-
 Lithuania
-
 Luxembourg
-
 Madagascar
-
 Malaysia
-
 Malta
-
 Mauritius
-
 Mexico
-
 Moldova
-
 Mongolia
-
 Montenegro
-
 Morocco
-
 Mozambique
-
 Myanmar
-
 Namibia
-
 Nepal
-
 Netherlands
-
 New Zealand
-
 Nigeria
-
 North Macedonia
-
 Norway
-
 Oman
-
 Pakistan
-
 Palestine
-
 Panama
-
 Papua New Guinea
-
 Paraguay
-
 Peru
-
 Philippines
-
 Poland
-
 Portugal
-
 Puerto Rico
-
 Qatar
-
 Reunion
-
 Romania
-
 Rwanda
-
 Saudi Arabia
-
 Serbia
-
 Singapore
-
 Slovakia
-
 Slovenia
-
 Somalia
-
 South Africa
-
 Spain
-
 Sri Lanka
-
 Sweden
-
 Switzerland
-
 Syria
-
 Taiwan
-
 Tajikistan
-
 Tanzania
-
 Thailand
-
 Trinidad and Tobago
-
 Tunisia
-
 Turkey
-
 UAE
-
 Uganda
-
 Ukraine
-
 United Kingdom
-
United States
-
 Uruguay
-
 Uzbekistan
-
 Venezuela
-
 Vietnam
-
 Yemen
-
 Zambia
-
 Zimbabwe
- Forex
- Crypto












