

Edison International stock selloff deepens as California wildfire liability legislation fails

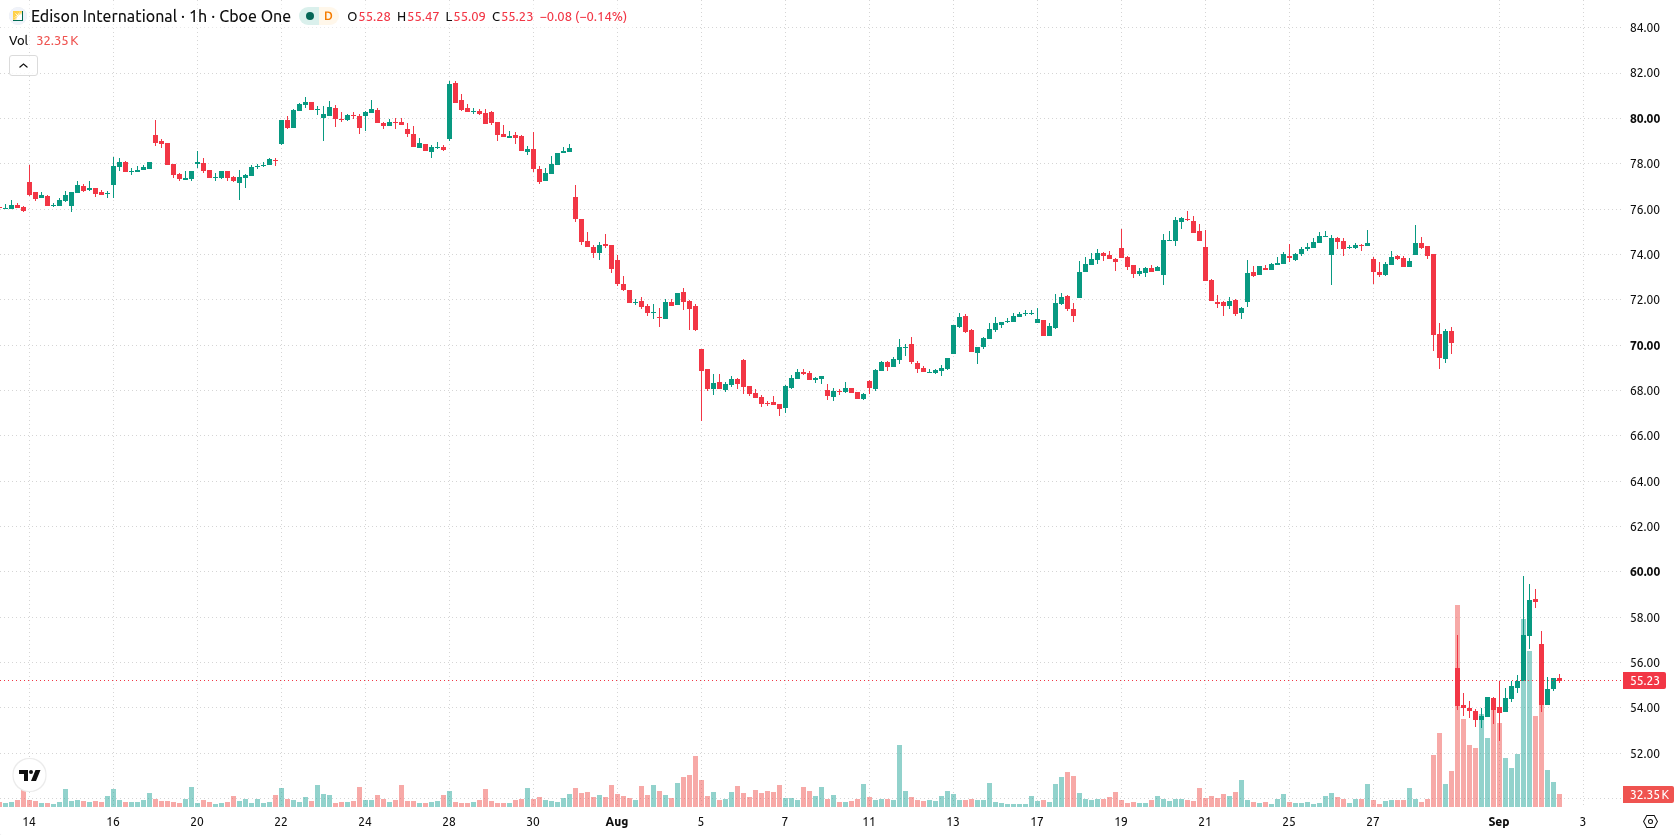
Edison International (EIX) stock is trading at $55.27 after a decline of 6% today, marking a sharp fall. The price is positioned below its key moving averages, reflecting broad selling momentum.
 60.44
60.65
Highlights
- California failed to pass wildfire liability protections, leaving Edison International stock more exposed to legal and regulatory risks.
- Edison International maintains 2026 full-year EPS guidance of $5.90 to $6.20 and a 5.9% annual dividend yield.
- Shares of Edison International fell 6% to $55.27, trading below key technical levels with strong selling pressure and a likely range of $45.21 to $65.33 in coming days.
Repricing of sector risk as wildfire legislation misses liability relief
California wildfire legislation recently failed to deliver the liability protections that utility investors had anticipated, leaving Edison International more exposed to potential legal and regulatory risks, according to Investinglive. This outcome has prompted a repricing of sector risk, contributing to the current negative sentiment around the stock. While Edison International has offered guidance of $5.90 to $6.20 in full-year earnings per share by 2026 and recently paid a quarterly dividend of $0.8775 per share, yielding 5.9% annually, these measures have provided only limited offset to the market's focus on regulatory uncertainty.
Bearish momentum strengthens as technical signals flash downside
On the technical front, EIX/USD is trading below the MA-20 and MA-50 on the H1 chart, with price action also remaining under the MA-200 on the daily timeframe. The Ichimoku Kijun level sits at $63.9, which now acts as immediate resistance. Recent session momentum is weak, with MACD flashing a strong sell signal and ADX still pointing to continued downside. RSI has dropped to 32.08—close to oversold territory, while both Stochastic RSI and CCI appear neutral, indicating short-term hesitation among oscillators. Bull/Bear Power is oversold, highlighting dominant intraday seller pressure, while the Awesome Oscillator is currently neutral and not supportive of the downtrend.
Wider volatility range seen as downside risk dominates outlook
Over the next several trading days, the expected price range for EIX/USD lies between $45.21 and $65.33, marking a wide volatility band relative to the current level. Probability of an upward breakout is very low, while further declines hold a high likelihood within this range. The baseline scenario calls for consolidation between immediate support and resistance, with a bullish reversal requiring a clear break above $63.9. A bearish scenario would be confirmed if price action breaches key support, setting up for deeper losses.
Earlier, analysts noted that Edison International faced sustained downside pressure and continued technical weakness. The current analysis strengthens that view, as persistent regulatory headwinds and fresh breakdowns below key technical levels increase the risk of a further move toward the lower end of the present wide volatility range.






Latest Edison International News



-
 Afghanistan
-
 Albania
-
 Algeria
-
 Angola
-
 Argentina
-
 Armenia
-
 Australia
-
 Austria
-
 Azerbaijan
-
 Bahamas
-
 Bahrain
-
 Bangladesh
-
 Belarus
-
 Belgium
-
 Bolivia
-
 Botswana
-
 Brazil
-
 Brunei
-
 Bulgaria
-
 Cambodia
-
 Cameroon
-
 Canada
-
 Chile
-
 China
-
 Colombia
-
 Congo
-
 Costa Rica
-
 Cote d'Ivoire
-
 Croatia
-
 Cuba
-
 Cyprus
-
 Czechia
-
 DR Congo
-
 Denmark
-
 Dominican Republic
-
 Ecuador
-
 Egypt
-
 El Salvador
-
 Estonia
-
 Eswatini
-
 Ethiopia
-
 Finland
-
 France
-
 Georgia
-
 Germany
-
 Ghana
-
 Greece
-
 Haiti
-
 Hong Kong
-
 Hungary
-
 India
-
 Indonesia
-
 Iran, Islamic republic
-
 Iraq
-
 Ireland
-
 Israel
-
 Italy
-
 Jamaica
-
 Japan
-
 Jordan
-
 Kazakhstan
-
 Kenya
-
 Korea
-
 Kuwait
-
 Kyrgyzstan
-
 Laos
-
 Latvia
-
 Lebanon
-
 Lesotho
-
 Libya
-
 Lithuania
-
 Luxembourg
-
 Madagascar
-
 Malaysia
-
 Malta
-
 Mauritius
-
 Mexico
-
 Moldova
-
 Mongolia
-
 Montenegro
-
 Morocco
-
 Mozambique
-
 Myanmar
-
 Namibia
-
 Nepal
-
 Netherlands
-
 New Zealand
-
 Nigeria
-
 North Macedonia
-
 Norway
-
 Oman
-
 Pakistan
-
 Palestine
-
 Panama
-
 Papua New Guinea
-
 Paraguay
-
 Peru
-
 Philippines
-
 Poland
-
 Portugal
-
 Puerto Rico
-
 Qatar
-
 Reunion
-
 Romania
-
 Rwanda
-
 Saudi Arabia
-
 Serbia
-
 Singapore
-
 Slovakia
-
 Slovenia
-
 Somalia
-
 South Africa
-
 Spain
-
 Sri Lanka
-
 Sweden
-
 Switzerland
-
 Syria
-
 Taiwan
-
 Tajikistan
-
 Tanzania
-
 Thailand
-
 Trinidad and Tobago
-
 Tunisia
-
 Turkey
-
 UAE
-
 Uganda
-
 Ukraine
-
 United Kingdom
-
United States
-
 Uruguay
-
 Uzbekistan
-
 Venezuela
-
 Vietnam
-
 Yemen
-
 Zambia
-
 Zimbabwe
- Forex
- Crypto












