


Axon (AXON) stock is trading at $563.66, down 6.21% on the day, and closing near the session low amid high volatility. The price currently sits below its short- and medium-term moving averages, while remaining above long-term support levels.
 325.90
Highlights
- Shares of AXON closed at $563.66, down 6.21% with a large gap and high volatility.
- The stock trades below short- and medium-term moving averages, confirming ongoing selling pressure.
- Price is expected to fluctuate between $550.41 and $586.92 in coming days with strong downside risk and weak momentum signals.
Bearish momentum persists as key supports hold above oversold signals
On the technical front, AXON is trading below the SMA-20 and SMA-50 on the H1 chart, while the price remains above the SMA-200 on the daily timeframe. The Ichimoku Kijun at $597.62 acts as immediate resistance. Momentum signals are weak, with both MACD and ADX indicating bearish conditions. RSI, Stoch RSI, and CCI all show oversold readings, highlighting persistent downside pressure. Bull/Bear Power confirms sellers are dominating intraday, while the Awesome Oscillator is neutral. Overall, price action confirms that bears are currently in control.
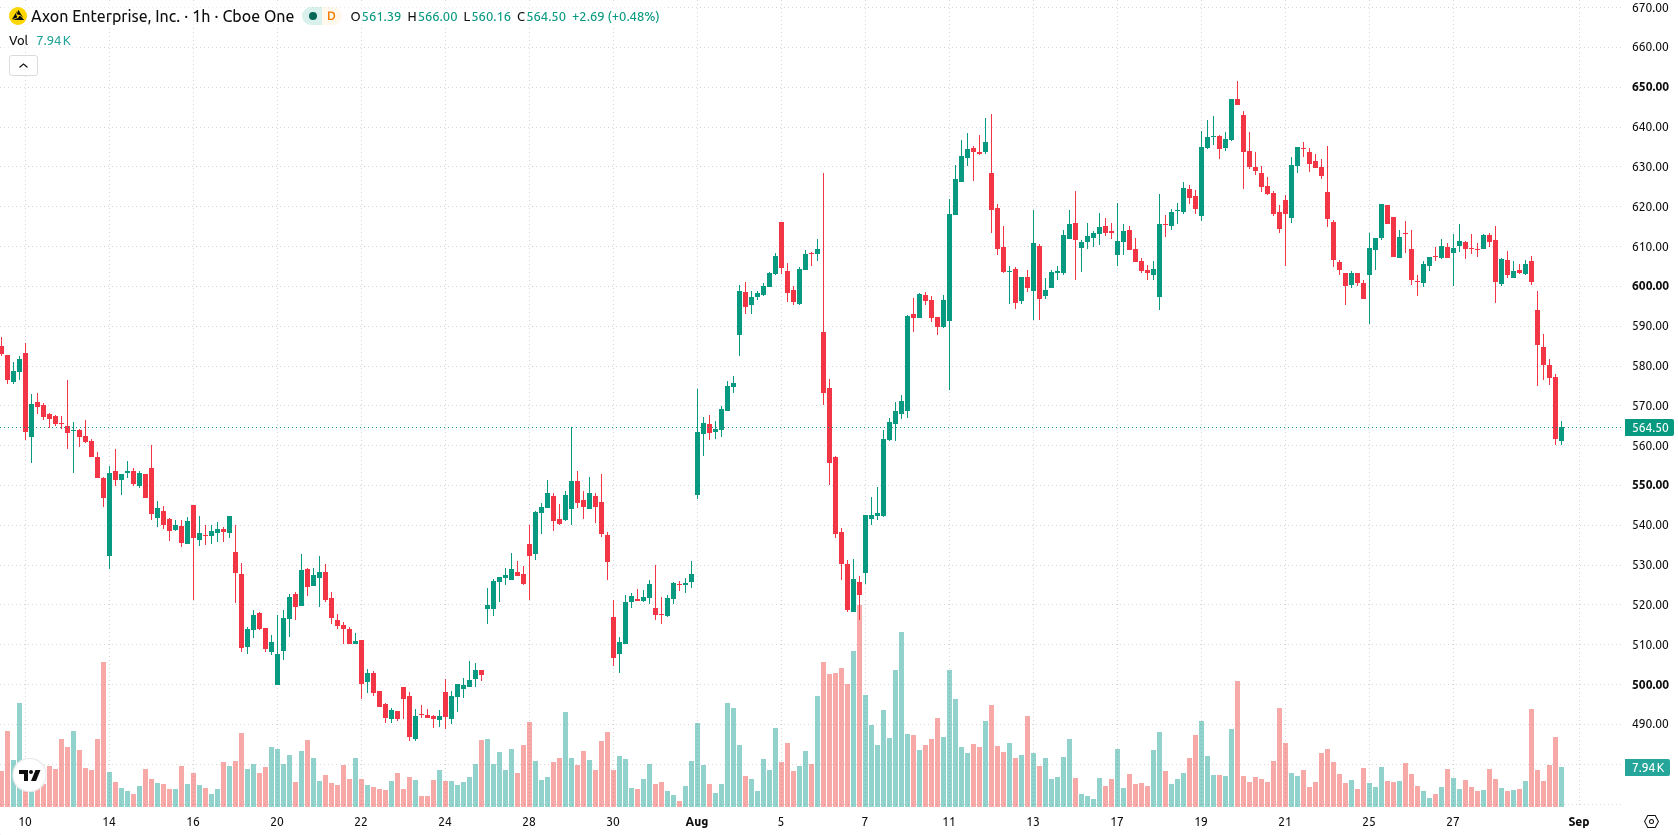
Downside risks remain elevated as volatility constrains upside potential
In the near term, AXON is expected to fluctuate between $550.41 and $586.92, reflecting a typical volatility band relative to current levels. The probability of an upward move is very low, with continued downside seen as highly likely. The base case is continued sideways trading within this range, with an upward scenario depending on a clear break above immediate resistance. Further weakness may develop if the lower boundary of projected support is breached, intensifying short-term downside risks.
Earlier, analysts noted that Axon's share price was under short-term selling pressure, despite maintaining a broadly bullish longer-term structure. The current analysis strengthens this conclusion with fresh technical evidence of persistent intraday downside momentum, highlighting the importance of monitoring $550.41 as the critical support level for potential further weakness.






Latest Axon Enterprise Inc News




-
 Afghanistan
-
 Albania
-
 Algeria
-
 Angola
-
 Argentina
-
 Armenia
-
 Australia
-
 Austria
-
 Azerbaijan
-
 Bahamas
-
 Bahrain
-
 Bangladesh
-
 Belarus
-
 Belgium
-
 Bolivia
-
 Botswana
-
 Brazil
-
 Brunei
-
 Bulgaria
-
 Cambodia
-
 Cameroon
-
 Canada
-
 Chile
-
 China
-
 Colombia
-
 Congo
-
 Costa Rica
-
 Cote d'Ivoire
-
 Croatia
-
 Cuba
-
 Cyprus
-
 Czechia
-
 DR Congo
-
 Denmark
-
 Dominican Republic
-
 Ecuador
-
 Egypt
-
 El Salvador
-
 Estonia
-
 Eswatini
-
 Ethiopia
-
 Finland
-
 France
-
 Georgia
-
 Germany
-
 Ghana
-
 Greece
-
 Haiti
-
 Hong Kong
-
 Hungary
-
 India
-
 Indonesia
-
 Iran, Islamic republic
-
 Iraq
-
 Ireland
-
 Israel
-
 Italy
-
 Jamaica
-
 Japan
-
 Jordan
-
 Kazakhstan
-
 Kenya
-
 Korea
-
 Kuwait
-
 Kyrgyzstan
-
 Laos
-
 Latvia
-
 Lebanon
-
 Lesotho
-
 Libya
-
 Lithuania
-
 Luxembourg
-
 Madagascar
-
 Malaysia
-
 Malta
-
 Mauritius
-
 Mexico
-
 Moldova
-
 Mongolia
-
 Montenegro
-
 Morocco
-
 Mozambique
-
 Myanmar
-
 Namibia
-
 Nepal
-
 Netherlands
-
 New Zealand
-
 Nigeria
-
 North Macedonia
-
 Norway
-
 Oman
-
 Pakistan
-
 Palestine
-
 Panama
-
 Papua New Guinea
-
 Paraguay
-
 Peru
-
 Philippines
-
 Poland
-
 Portugal
-
 Puerto Rico
-
 Qatar
-
 Reunion
-
 Romania
-
 Rwanda
-
 Saudi Arabia
-
 Serbia
-
 Singapore
-
 Slovakia
-
 Slovenia
-
 Somalia
-
 South Africa
-
 Spain
-
 Sri Lanka
-
 Sweden
-
 Switzerland
-
 Syria
-
 Taiwan
-
 Tajikistan
-
 Tanzania
-
 Thailand
-
 Trinidad and Tobago
-
 Tunisia
-
 Turkey
-
 UAE
-
 Uganda
-
 Ukraine
-
 United Kingdom
-
United States
-
 Uruguay
-
 Uzbekistan
-
 Venezuela
-
 Vietnam
-
 Yemen
-
 Zambia
-
 Zimbabwe
- Forex
- Crypto












