

Marathon Digital shares technical analysis: Support test at $9.42

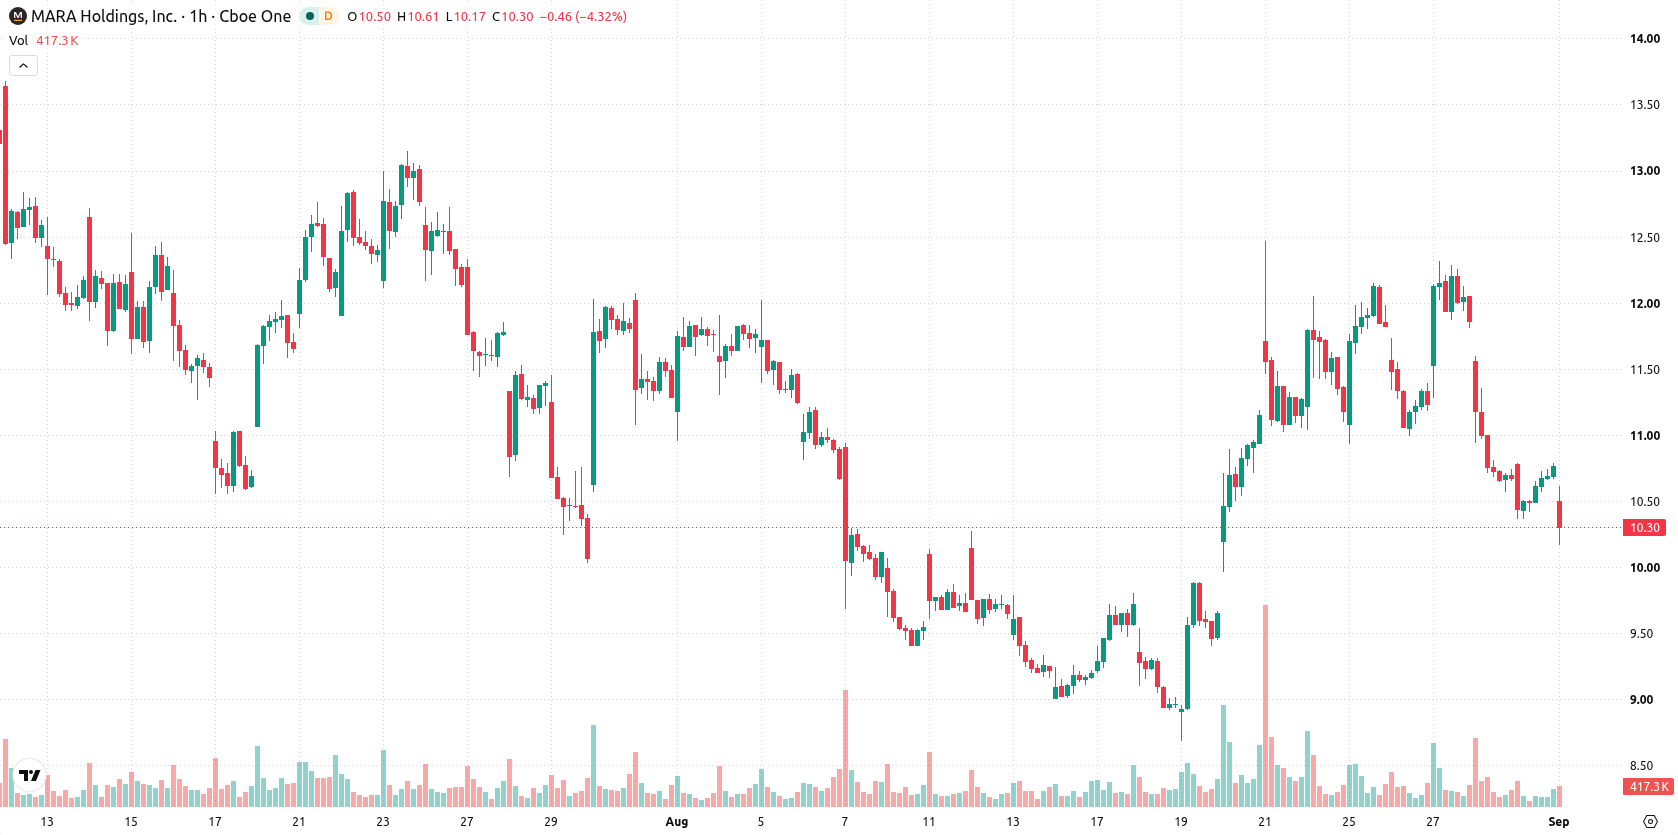
Marathon Digital (MARA) stock is trading at $10.29, down 4.5% on the session. The price is positioned below its key moving averages, reflecting notable weakness in the short and medium term.
 7.05
7.46
Highlights
- Shares of MARA closed at $10.29 after falling 4.5 percent, settling near the session low during high volatility.
- The stock remains below short, medium, and long-term moving averages, indicating ongoing pressure from sellers.
- Technical indicators project a high probability of further downside within a $9.42 to $11.16 trading range, with a low likelihood of an upward reversal.
Bearish signals intensify with resistance and momentum divergence
On the H1 chart, MARA remains below the MA-20 at $11.11 and MA-50 at $11.34, with long-term MA-200 overhead at $10.95. The Ichimoku Kijun is set at $11.34, presenting immediate resistance. Momentum indicators continue to show a bearish tilt, as MACD and ADX both generate Sell signals. RSI is at 43.65, indicating bearish momentum, while Stoch RSI is Overbought and CCI is Neutral, reflecting some divergence among oscillators. Bull/Bear Power indicates that sellers have dominated intraday action, while the Awesome Oscillator is Neutral, providing no confirmation of the prevailing downtrend. High volatility has marked the session, with the price closing near its session lows.
Downside risk heightened as support and volatility converge
In the near term, the expected trading range for MARA is $9.42 to $11.16, representing a typical volatility band relative to current levels. The probability of a downward move is considered very high, with an upward reversal scenario viewed as much less likely unless resistance near $11.34 is broken. The baseline expectation is for sideways movement within this range, with additional downside risk if support at $9.42 fails to hold.
Earlier, analysts noted that Marathon Digital was consolidating with technical signals pointing to persistent selling pressure and no established directional trend. The current analysis reinforces this negative bias, highlighting a heightened risk of further downside should support at $9.42 fail to contain the weakness.









-
 Afghanistan
-
 Albania
-
 Algeria
-
 Angola
-
 Argentina
-
 Armenia
-
 Australia
-
 Austria
-
 Azerbaijan
-
 Bahamas
-
 Bahrain
-
 Bangladesh
-
 Belarus
-
 Belgium
-
 Bolivia
-
 Botswana
-
 Brazil
-
 Brunei
-
 Bulgaria
-
 Cambodia
-
 Cameroon
-
 Canada
-
 Chile
-
 China
-
 Colombia
-
 Congo
-
 Costa Rica
-
 Cote d'Ivoire
-
 Croatia
-
 Cuba
-
 Cyprus
-
 Czechia
-
 DR Congo
-
 Denmark
-
 Dominican Republic
-
 Ecuador
-
 Egypt
-
 El Salvador
-
 Estonia
-
 Eswatini
-
 Ethiopia
-
 Finland
-
 France
-
 Georgia
-
 Germany
-
 Ghana
-
 Greece
-
 Haiti
-
 Hong Kong
-
 Hungary
-
 India
-
 Indonesia
-
 Iran, Islamic republic
-
 Iraq
-
 Ireland
-
 Israel
-
 Italy
-
 Jamaica
-
 Japan
-
 Jordan
-
 Kazakhstan
-
 Kenya
-
 Korea
-
 Kuwait
-
 Kyrgyzstan
-
 Laos
-
 Latvia
-
 Lebanon
-
 Lesotho
-
 Libya
-
 Lithuania
-
 Luxembourg
-
 Madagascar
-
 Malaysia
-
 Malta
-
 Mauritius
-
 Mexico
-
 Moldova
-
 Mongolia
-
 Montenegro
-
 Morocco
-
 Mozambique
-
 Myanmar
-
 Namibia
-
 Nepal
-
 Netherlands
-
 New Zealand
-
 Nigeria
-
 North Macedonia
-
 Norway
-
 Oman
-
 Pakistan
-
 Palestine
-
 Panama
-
 Papua New Guinea
-
 Paraguay
-
 Peru
-
 Philippines
-
 Poland
-
 Portugal
-
 Puerto Rico
-
 Qatar
-
 Reunion
-
 Romania
-
 Rwanda
-
 Saudi Arabia
-
 Serbia
-
 Singapore
-
 Slovakia
-
 Slovenia
-
 Somalia
-
 South Africa
-
 Spain
-
 Sri Lanka
-
 Sweden
-
 Switzerland
-
 Syria
-
 Taiwan
-
 Tajikistan
-
 Tanzania
-
 Thailand
-
 Trinidad and Tobago
-
 Tunisia
-
 Turkey
-
 UAE
-
 Uganda
-
 Ukraine
-
 United Kingdom
-
United States
-
 Uruguay
-
 Uzbekistan
-
 Venezuela
-
 Vietnam
-
 Yemen
-
 Zambia
-
 Zimbabwe
- Forex
- Crypto












