

Mastercard shares weekly forecast: Recovery holds near immediate support with resistance in focus

Shares of Mastercard Inc (MA) are trading near $591 as recovery attempts hold the week’s gains, but buyers face a stretched setup. The coming week will put recent strength to the test as supportive corporate news mixes with cautions about momentum easing.
 606.61
605.44
606.61
605.44
Highlights
- Shares of Mastercard are trading at $590.99, slightly lower over the past week but sustaining a strong bullish structure.
- Technical indicators show ongoing buyer strength, but the stock is nearing overbought conditions and momentum may slow if gains continue.
- The forecasted range for the week ahead is $585.58 to $608.5, with key support at $588.25 and resistance at $600.33.
Earnings beat and acquisition news drive sentiment into the coming week
MA reported Q2 2026 revenue of $9.3 billion, up 14% year-over-year, and adjusted earnings per share of $5.04, beating analyst expectations, according to TradingKey. The August 3, 2026, acquisition of BVNK is set to expand MA’s digital payments reach, while recent leadership changes and ongoing share buybacks point to a focus on growth and capital returns. Upcoming participation in the September 10 Goldman Sachs investor conference may further shape sentiment in the week ahead.
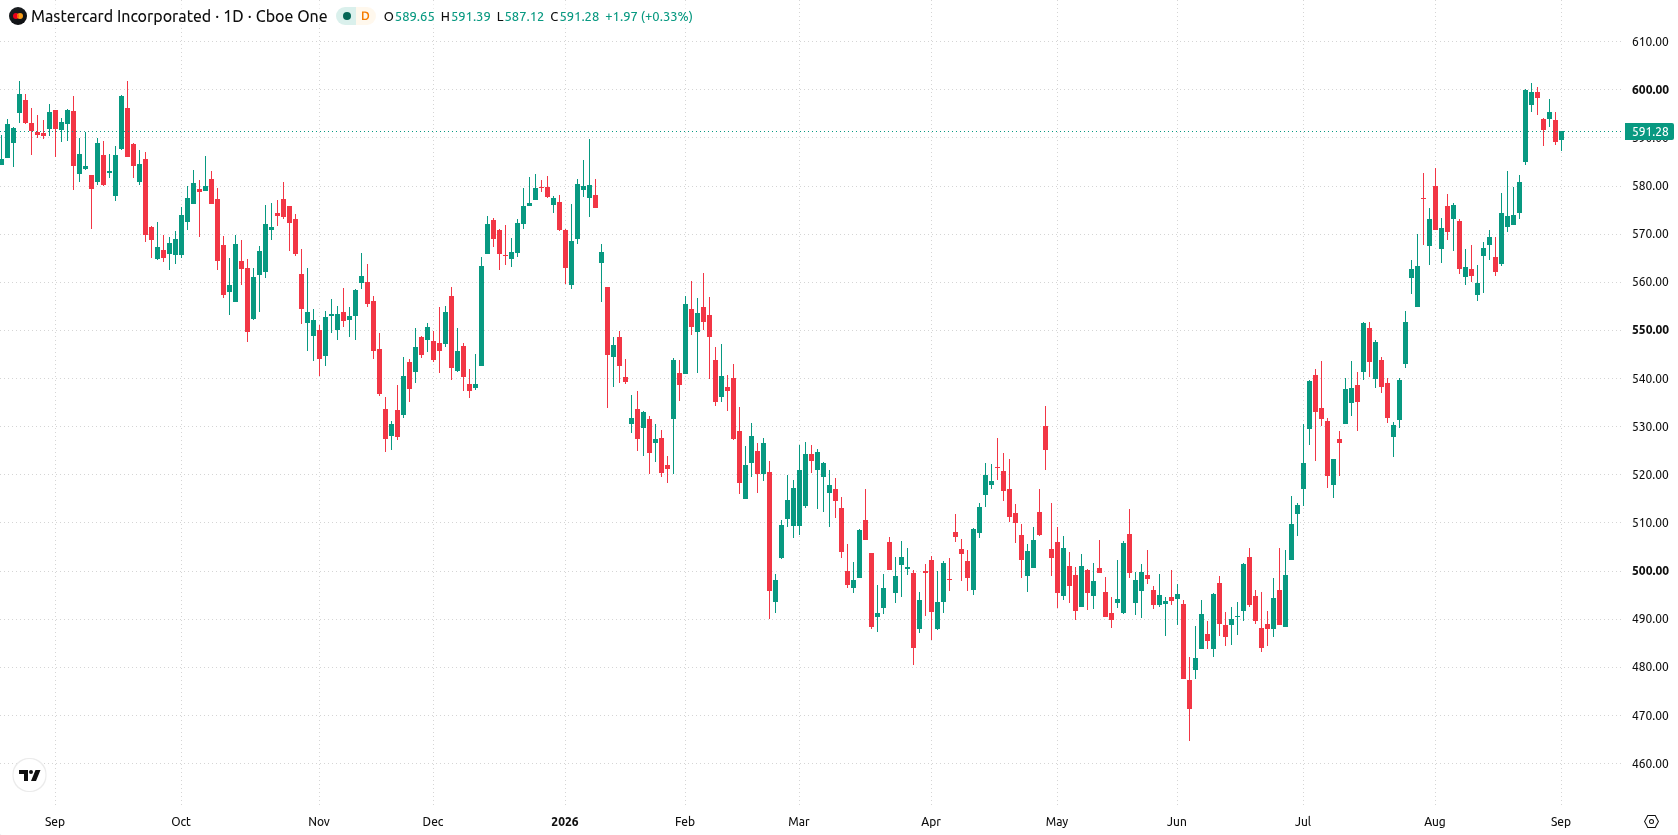
Buyer advantage persists as technicals approach overbought territory this week
On the daily chart, the stock is showing a trending structure, with price action characterised by a sustained move lower with a firm trend and a past-week volatility of 2.05%. The MACD, currently positive at 15.35, and ADX at 33.93, both point to continued buyer strength, while RSI at 62.15 is approaching overbought levels, suggesting momentum could approach exhaustion if gains extend further. Immediate support is at $588.25, near the current price, while resistance stands at $600.33. The Ichimoku Kijun at $571.17 provides an additional layer of support.
Rangebound consolidation likely as breakout risk emerges next week
In the week ahead, Mastercard is forecast to trade between $585.58 and $608.5. There is a 73% probability of an increase and a 27% probability of a decrease. The base case scenario anticipates consolidation and trending action inside the expected range between support at $588.25 and resistance at $600.33. A sustained move above $600.33 would target further upside, while a decisive drop below $588.25 could expose the lower boundary of the forecasted range.
Earlier, analysts noted that Mastercard’s strong earnings and sustained uptrend raised the potential for further gains, while cautioning that momentum indicators were at extended levels. With the current consolidation near key technical thresholds and recent corporate developments in focus, traders should closely monitor $600.33 as the critical level for a potential breakout or reversal in the coming week.





Latest Mastercard News






-
 Afghanistan
-
 Albania
-
 Algeria
-
 Angola
-
 Argentina
-
 Armenia
-
 Australia
-
 Austria
-
 Azerbaijan
-
 Bahamas
-
 Bahrain
-
 Bangladesh
-
 Belarus
-
 Belgium
-
 Bolivia
-
 Botswana
-
 Brazil
-
 Brunei
-
 Bulgaria
-
 Cambodia
-
 Cameroon
-
 Canada
-
 Chile
Chile
-
 China
China
-
 Colombia
-
 Congo
Congo
-
 Costa Rica
-
 Cote d'Ivoire
-
 Croatia
-
 Cuba
Cuba
-
 Cyprus
-
 Czechia
-
 DR Congo
-
 Denmark
-
 Dominican Republic
-
 Ecuador
-
 Egypt
Egypt
-
 El Salvador
-
 Estonia
-
 Eswatini
-
 Ethiopia
-
 Finland
-
 France
-
 Georgia
-
 Germany
-
 Ghana
Ghana
-
 Greece
-
 Haiti
Haiti
-
 Hong Kong
-
 Hungary
-
 India
India
-
 Indonesia
-
 Iran, Islamic republic
-
 Iraq
Iraq
-
 Ireland
-
 Israel
-
 Italy
Italy
-
 Jamaica
-
 Japan
Japan
-
 Jordan
-
 Kazakhstan
-
 Kenya
Kenya
-
 Korea
Korea
-
 Kuwait
-
 Kyrgyzstan
-
 Laos
Laos
-
 Latvia
-
 Lebanon
-
 Lesotho
-
 Libya
Libya
-
 Lithuania
-
 Luxembourg
-
 Madagascar
-
 Malaysia
-
 Malta
Malta
-
 Mauritius
-
 Mexico
-
 Moldova
-
 Mongolia
-
 Montenegro
-
 Morocco
-
 Mozambique
-
 Myanmar
-
 Namibia
-
 Nepal
Nepal
-
 Netherlands
-
 New Zealand
-
 Nigeria
-
 North Macedonia
-
 Norway
-
 Oman
Oman
-
 Pakistan
-
 Palestine
-
 Panama
-
 Papua New Guinea
-
 Paraguay
-
 Peru
Peru
-
 Philippines
-
 Poland
-
 Portugal
-
 Puerto Rico
-
 Qatar
Qatar
-
 Reunion
-
 Romania
-
 Rwanda
-
 Saudi Arabia
-
 Serbia
-
 Singapore
-
 Slovakia
-
 Slovenia
-
 Somalia
-
 South Africa
-
 Spain
Spain
-
 Sri Lanka
-
 Sweden
-
 Switzerland
-
 Syria
Syria
-
 Taiwan
-
 Tajikistan
-
 Tanzania
-
 Thailand
-
 Trinidad and Tobago
-
 Tunisia
-
 Turkey
-
 UAE
UAE
-
 Uganda
-
 Ukraine
-
 United Kingdom
-
United States
-
 Uruguay
-
 Uzbekistan
-
 Venezuela
-
 Vietnam
-
 Yemen
Yemen
-
 Zambia
-
 Zimbabwe
- Forex
- Crypto












