

Walmart shares weekly forecast: Consolidation expected as MACD stays in sell territory

Shares of Walmart Inc. (WMT) are trading near $106 after a week marked by a gain of just over 3%, as sellers have kept steady pressure with the stock approaching deep oversold territory. Despite mixed price action, the setup remains fragile with downside risks taking prominence for the week ahead.
 128.26
Highlights
- Shares of Walmart rose $3.04 over the week to $106.12, trading near the top of the recent range.
- The stock continues to trade below key moving averages, with momentum and indicators suggesting persistent bearish pressure.
- Expected range for the coming week is $103.46 to $107.69, with a 67% probability of a decrease and key support at $105.84.
Shares retreat on earnings strength offset by regulatory setbacks
Walmart reported its fiscal Q2 2027 earnings on August 20, 2026, with revenue climbing to $187.9 billion, a 5.94% year-over-year increase, while global e-commerce sales grew 23% and advertising sales jumped 38%, according to Yahoo Finance and The Motley Fool. Shares declined following the results, despite a raised full-year outlook, as the health and wellness segment was hit by drug-pricing regulation and a shift toward generics. The company also settled a U.S. government lawsuit over opioid prescription practices on August 28, 2026, and announced a new fulfillment center project in Georgia to add 1,000 jobs, as confirmed by the Department of Justice and the Georgia Department of Economic Development.
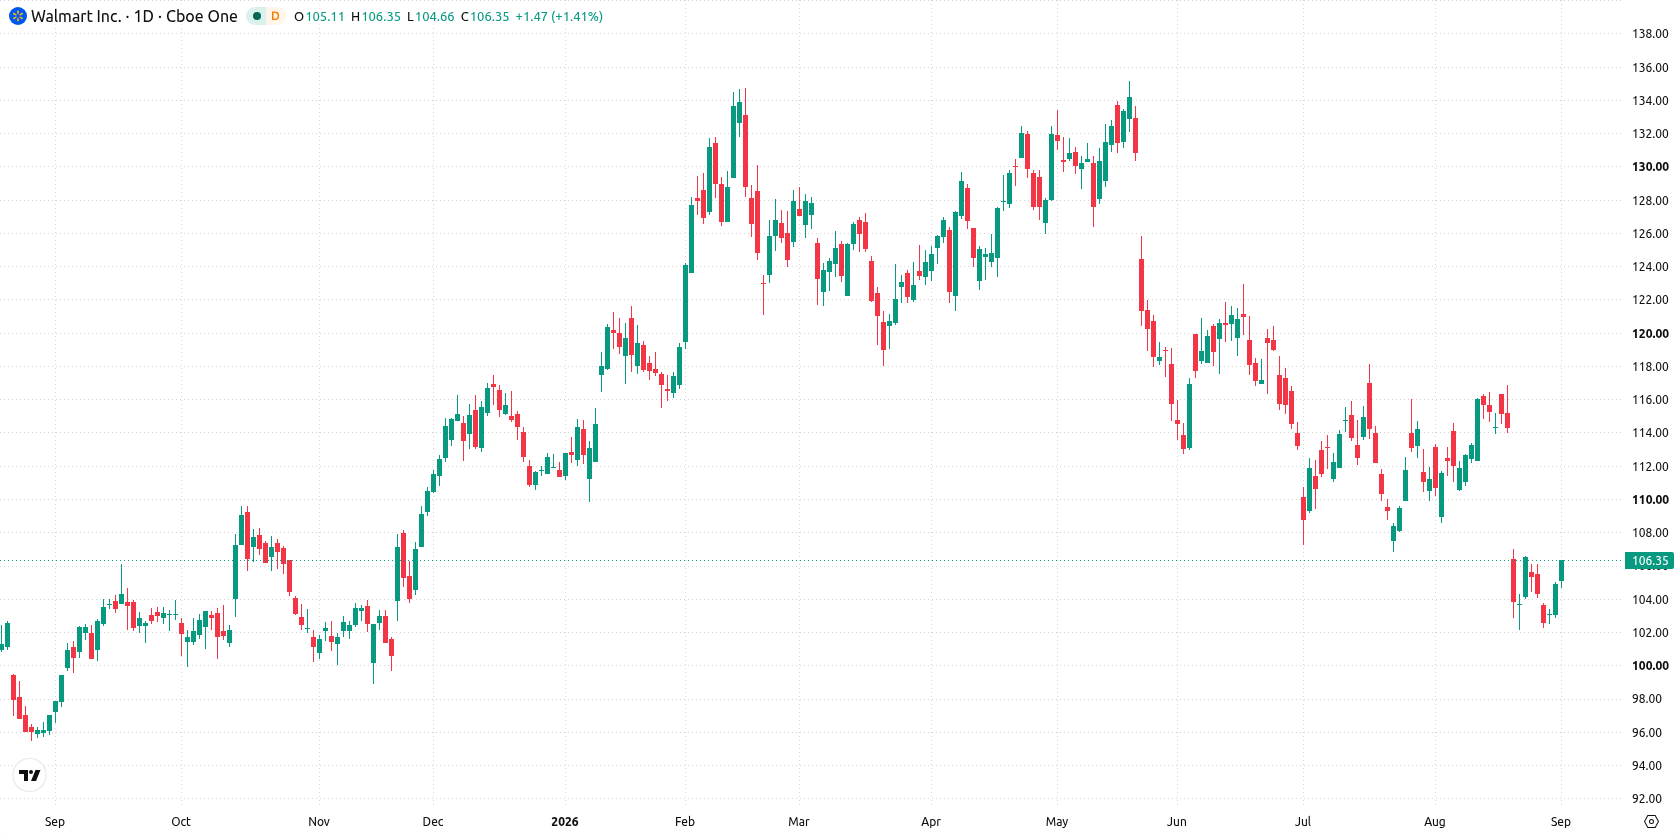
Bearish signals persist this week as technicals test key support
On the daily chart, the price continues to press against the $105.84 support, while broader momentum stays mixed. MACD remains in sell territory with a value of -3.45, and RSI sits at 38.77, approaching oversold, highlighting ongoing bearish pressure despite the recent advance. Volatility remains moderate at 3.45%, with the move characterized as a contained move within a narrow range. The next resistance is found at the Ichimoku Kijun level of $109.57, tightening the immediate trading corridor.
Downside bias next week as consolidation persists below resistance
For the coming trading week, the expected range for Walmart stock is $103.46 to $107.69. The probability of an increase stands at 33%, while the chance of a decrease is 67%. The base case calls for continued consolidation between support at $105.84 and resistance at $109.57. A bullish break above $109.57 would open the way for additional gains, while sustained action below $105.84 could see the stock press towards the lower end of the range near $103.46.
Earlier, analysts noted that Walmart’s strategy of using tariff refunds to lower prices for consumers was shaping both its financial results and industry expectations. With the company now navigating ongoing regulatory headwinds and a challenging technical setup, traders should monitor the $105.84 support level as a pivotal inflection point for near-term direction.






Latest Walmart News





-
 Afghanistan
-
 Albania
-
 Algeria
-
 Angola
-
 Argentina
-
 Armenia
-
 Australia
-
 Austria
-
 Azerbaijan
-
 Bahamas
-
 Bahrain
-
 Bangladesh
-
 Belarus
-
 Belgium
-
 Bolivia
-
 Botswana
-
 Brazil
-
 Brunei
-
 Bulgaria
-
 Cambodia
-
 Cameroon
-
 Canada
-
 Chile
-
 China
-
 Colombia
-
 Congo
-
 Costa Rica
-
 Cote d'Ivoire
-
 Croatia
-
 Cuba
-
 Cyprus
-
 Czechia
-
 DR Congo
-
 Denmark
-
 Dominican Republic
-
 Ecuador
-
 Egypt
-
 El Salvador
-
 Estonia
-
 Eswatini
-
 Ethiopia
-
 Finland
-
 France
-
 Georgia
-
 Germany
-
 Ghana
-
 Greece
-
 Haiti
-
 Hong Kong
-
 Hungary
-
 India
-
 Indonesia
-
 Iran, Islamic republic
-
 Iraq
-
 Ireland
-
 Israel
-
 Italy
-
 Jamaica
-
 Japan
-
 Jordan
-
 Kazakhstan
-
 Kenya
-
 Korea
-
 Kuwait
-
 Kyrgyzstan
-
 Laos
-
 Latvia
-
 Lebanon
-
 Lesotho
-
 Libya
-
 Lithuania
-
 Luxembourg
-
 Madagascar
-
 Malaysia
-
 Malta
-
 Mauritius
-
 Mexico
-
 Moldova
-
 Mongolia
-
 Montenegro
-
 Morocco
-
 Mozambique
-
 Myanmar
-
 Namibia
-
 Nepal
-
 Netherlands
-
 New Zealand
-
 Nigeria
-
 North Macedonia
-
 Norway
-
 Oman
-
 Pakistan
-
 Palestine
-
 Panama
-
 Papua New Guinea
-
 Paraguay
-
 Peru
-
 Philippines
-
 Poland
-
 Portugal
-
 Puerto Rico
-
 Qatar
-
 Reunion
-
 Romania
-
 Rwanda
-
 Saudi Arabia
-
 Serbia
-
 Singapore
-
 Slovakia
-
 Slovenia
-
 Somalia
-
 South Africa
-
 Spain
-
 Sri Lanka
-
 Sweden
-
 Switzerland
-
 Syria
-
 Taiwan
-
 Tajikistan
-
 Tanzania
-
 Thailand
-
 Trinidad and Tobago
-
 Tunisia
-
 Turkey
-
 UAE
-
 Uganda
-
 Ukraine
-
 United Kingdom
-
United States
-
 Uruguay
-
 Uzbekistan
-
 Venezuela
-
 Vietnam
-
 Yemen
-
 Zambia
-
 Zimbabwe
- Forex
- Crypto












