

AMD stock pullback persists amid sellers dominating medium-term trend

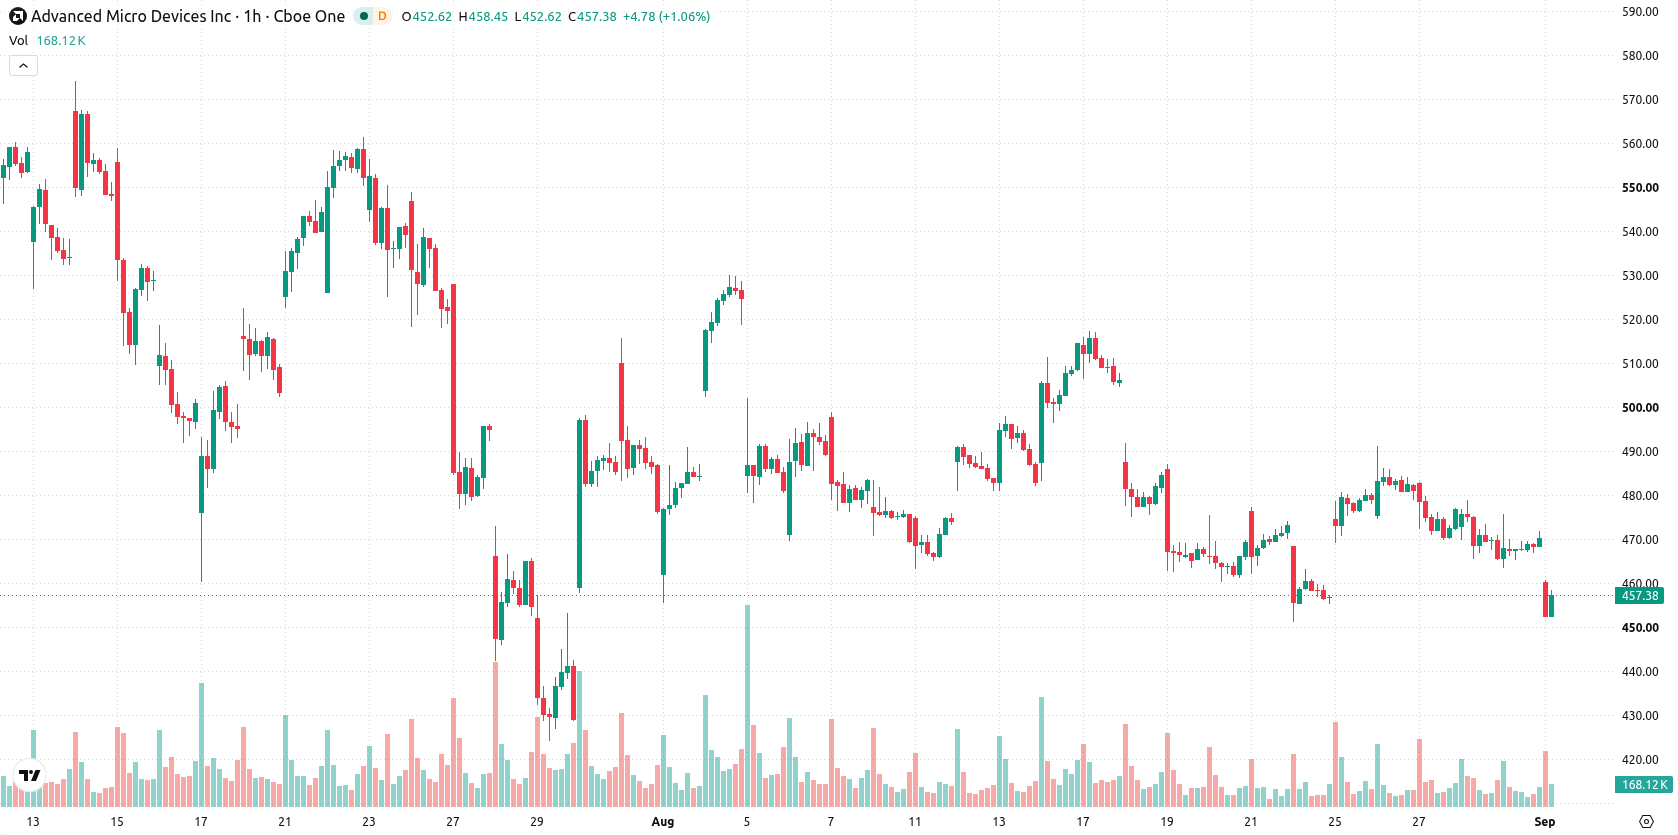
AMD (AMD) stock is trading at $456.71, down 2.87% on the day. The price sits below its key short- and medium-term moving averages but remains supported above longer-term averages.
 508.16
578.75
Highlights
- AMD stock revenue climbed 50.1% year over year to $11.54 billion, with non-GAAP operating income up 245%.
- Sales momentum and improved operating efficiency drove increased demand and profitability across AMD’s core business lines.
- Shares of AMD fell 2.87% in a volatile session and are expected to trade between $445.43 and $471.18, with technicals signaling near-term downside pressure.
Profit surge boosts outlook despite price lag on selling pressure
AMD reported 50.1% year-over-year revenue growth to $11.54 billion alongside a 245% increase in non-GAAP operating income, highlighting substantial sales momentum and improved operating efficiency for the latest period. These robust figures demonstrate meaningful gains in demand and profitability across AMD’s core business lines. The release of such strong financial results typically supports the company’s valuation outlook, though price action has remained under broader selling pressure.
Mixed momentum as short-term averages slip, intraday buyers persist
On the technical front, AMD is trading below the MA-20 and MA-50 on the h1 chart, indicating ongoing short- and medium-term downside pressure, while remaining well above the MA-200 on the daily chart. The Ichimoku Kijun sits at $474.03 and serves as nearby resistance. Among momentum indicators, MACD is on Sell, ADX is Neutral, and RSI reads 47.09 (Sell), with Stochastic RSI, CCI, and the Awesome Oscillator all showing Neutral signals. Bull/Bear Power highlights buyer dominance intraday, but this has not prevented the price from moving near session lows amid moderate volatility, suggesting mixed sentiment.
Downside favored in short term as resistance and volatility shape range
In the short term, AMD is forecast to trade within a $445.43 to $471.18 range, reflecting a typical volatility band relative to current levels. Probabilities favor a downward move with a 35% chance of upside based on current technical dynamics. The baseline scenario anticipates a period of sideways action unless resistance at $474.03 is decisively breached to the upside or the lower end of the projected range gives way to renewed selling.
Earlier, analysts noted that AMD's strategic focus on AI infrastructure and global partnerships added depth to its outlook, even as shares faced technical pressures and rangebound trading. The latest robust financial results further strengthen the company’s long-term positioning, but with technical indicators reflecting mixed momentum, traders should closely monitor the $445.43–$471.18 range for potential shifts in direction.






Latest AMD News





-
 Afghanistan
-
 Albania
-
 Algeria
-
 Angola
-
 Argentina
-
 Armenia
-
 Australia
-
 Austria
-
 Azerbaijan
-
 Bahamas
-
 Bahrain
-
 Bangladesh
-
 Belarus
-
 Belgium
-
 Bolivia
-
 Botswana
-
 Brazil
-
 Brunei
-
 Bulgaria
-
 Cambodia
-
 Cameroon
-
 Canada
-
 Chile
-
 China
-
 Colombia
-
 Congo
-
 Costa Rica
-
 Cote d'Ivoire
-
 Croatia
-
 Cuba
-
 Cyprus
-
 Czechia
-
 DR Congo
-
 Denmark
-
 Dominican Republic
-
 Ecuador
-
 Egypt
-
 El Salvador
-
 Estonia
-
 Eswatini
-
 Ethiopia
-
 Finland
-
 France
-
 Georgia
-
 Germany
-
 Ghana
-
 Greece
-
 Haiti
-
 Hong Kong
-
 Hungary
-
 India
-
 Indonesia
-
 Iran, Islamic republic
-
 Iraq
-
 Ireland
-
 Israel
-
 Italy
-
 Jamaica
-
 Japan
-
 Jordan
-
 Kazakhstan
-
 Kenya
-
 Korea
-
 Kuwait
-
 Kyrgyzstan
-
 Laos
-
 Latvia
-
 Lebanon
-
 Lesotho
-
 Libya
-
 Lithuania
-
 Luxembourg
-
 Madagascar
-
 Malaysia
-
 Malta
-
 Mauritius
-
 Mexico
-
 Moldova
-
 Mongolia
-
 Montenegro
-
 Morocco
-
 Mozambique
-
 Myanmar
-
 Namibia
-
 Nepal
-
 Netherlands
-
 New Zealand
-
 Nigeria
-
 North Macedonia
-
 Norway
-
 Oman
-
 Pakistan
-
 Palestine
-
 Panama
-
 Papua New Guinea
-
 Paraguay
-
 Peru
-
 Philippines
-
 Poland
-
 Portugal
-
 Puerto Rico
-
 Qatar
-
 Reunion
-
 Romania
-
 Rwanda
-
 Saudi Arabia
-
 Serbia
-
 Singapore
-
 Slovakia
-
 Slovenia
-
 Somalia
-
 South Africa
-
 Spain
-
 Sri Lanka
-
 Sweden
-
 Switzerland
-
 Syria
-
 Taiwan
-
 Tajikistan
-
 Tanzania
-
 Thailand
-
 Trinidad and Tobago
-
 Tunisia
-
 Turkey
-
 UAE
-
 Uganda
-
 Ukraine
-
 United Kingdom
-
United States
-
 Uruguay
-
 Uzbekistan
-
 Venezuela
-
 Vietnam
-
 Yemen
-
 Zambia
-
 Zimbabwe
- Forex
- Crypto












