

Will Dollar General stock break resistance as strong cash flow enables buybacks and dividends?

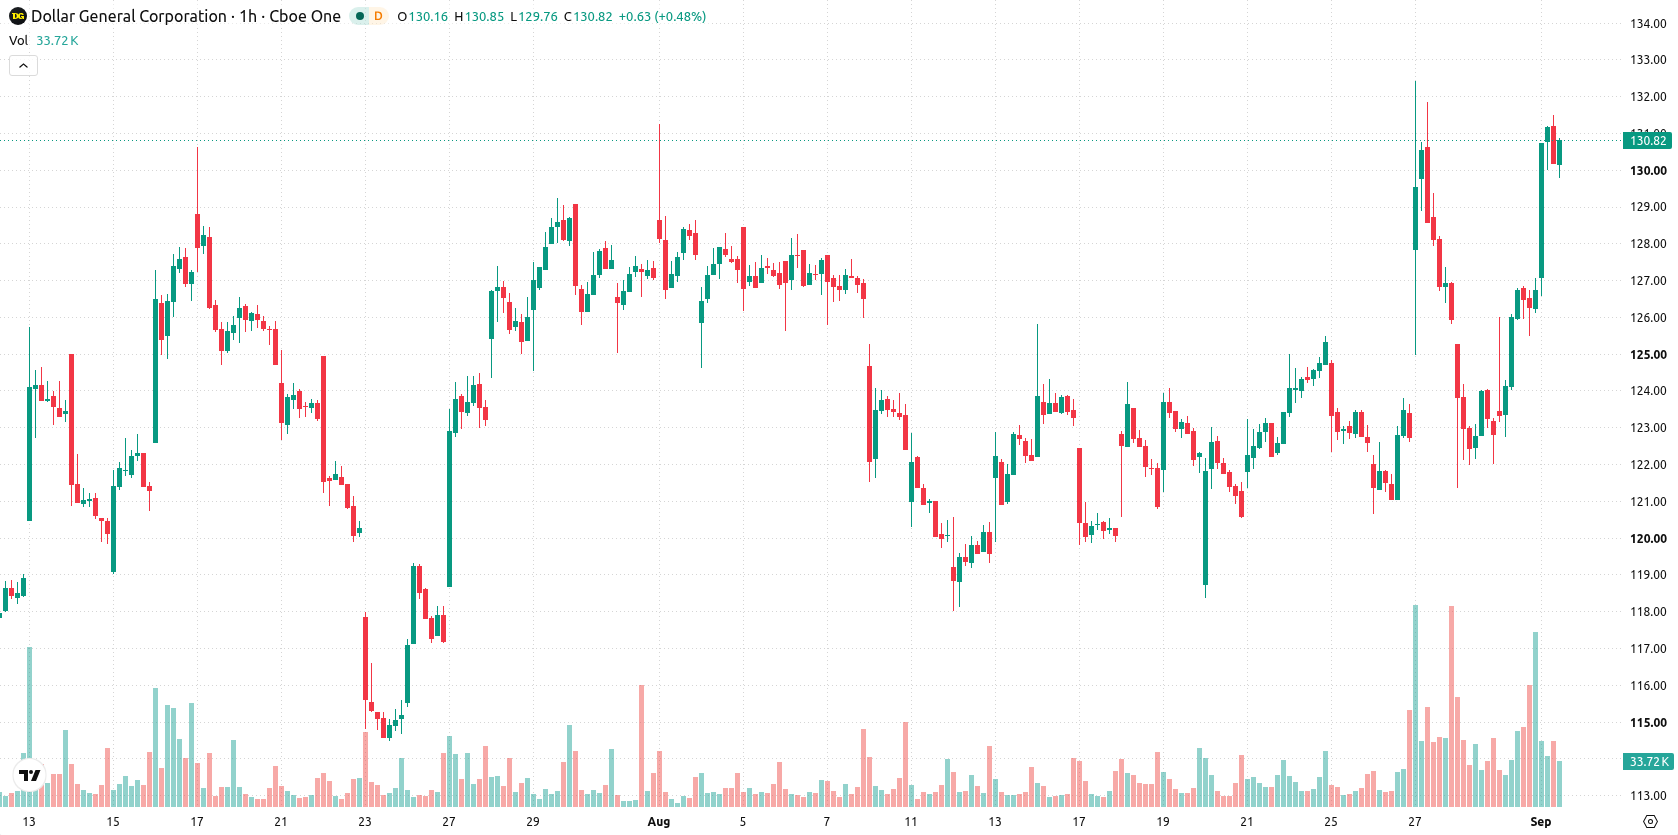
Dollar General (DG) stock is trading at $131.2, up 3.51% on the day. The price sits above its key moving averages, pointing to bullish pressure across short-, medium-, and long-term timeframes.
 137.20
144.30
Highlights
- Dollar General has generated $1.5 billion in operating cash flow year to date, supporting liquidity for growth and shareholder initiatives.
- The company invested $758 million in capital expenditures and announced a $0.59 per share quarterly dividend for Q2 2026, with up to $700 million authorized for share buybacks in the second half.
- Dollar General stock shows strong bullish momentum above key moving averages with an expected trading range of $126.05 to $136.35, but overbought technical signals suggest potential for short-term exhaustion.
Capital allocation and buybacks as investor optimism lifts shares
Dollar General has reported $1.5 billion in cash flow from operations year to date, providing the company with ample liquidity to fund shareholder returns and operational improvements. The business allocated $758 million in capital expenditures through the first half, targeting store upgrades and distribution projects that could drive future revenue growth. The Board's approval of a $0.59 per share quarterly dividend for Q2 2026, along with plans for up to $700 million in share repurchases in the second half, according to Fool, further underscores management's commitment to capital returns. Together, these developments support the upbeat investor sentiment driving current trading levels.
Overbought signals diverge from positive momentum at recent highs
DG trades well above the MA-20 and MA-50 on its active chart, and consistently holds above the daily MA-200. The Ichimoku Kijun provides immediate support at $126.73. Momentum indicators include a bullish MACD alongside a neutral ADX, while overbought conditions are highlighted by indicators such as RSI at 66.6, Stoch RSI, and CCI. Bull/Bear Power remains positive intraday, supported by a bullish Awesome Oscillator reading, and prices are consolidating near intraday highs of $131.2 with a minor gap of 0.27. However, overbought readings across multiple oscillators diverge from supportive momentum, pointing to a risk of near-term exhaustion.
Upside scenario prevails as breakout risk shapes short-term range
Over the next several trading days, the anticipated price range for DG is $126.05 to $136.35, with an up move holding a 77% probability and a significantly lower chance for downside. The baseline expectation is for price action to remain within this corridor, reflecting typical volatility around current levels. A breakout above resistance would trigger a bullish scenario, while a move below near-term support may open the door to a short-term pullback.
Earlier, analysts noted that Dollar General was regaining technical strength, supported by improved earnings and a more favorable outlook. The current analysis builds on this view by highlighting overbought momentum signals and a tightened trading range, indicating that traders should monitor for a potential breakout above $136.35 or a reversal below $126.05 in the coming sessions.










-
 Afghanistan
-
 Albania
-
 Algeria
-
 Angola
-
 Argentina
-
 Armenia
-
 Australia
-
 Austria
-
 Azerbaijan
-
 Bahamas
-
 Bahrain
-
 Bangladesh
-
 Belarus
-
 Belgium
-
 Bolivia
-
 Botswana
-
 Brazil
-
 Brunei
-
 Bulgaria
-
 Cambodia
-
 Cameroon
-
 Canada
-
 Chile
-
 China
-
 Colombia
-
 Congo
-
 Costa Rica
-
 Cote d'Ivoire
-
 Croatia
-
 Cuba
-
 Cyprus
-
 Czechia
-
 DR Congo
-
 Denmark
-
 Dominican Republic
-
 Ecuador
-
 Egypt
-
 El Salvador
-
 Estonia
-
 Eswatini
-
 Ethiopia
-
 Finland
-
 France
-
 Georgia
-
 Germany
-
 Ghana
-
 Greece
-
 Haiti
-
 Hong Kong
-
 Hungary
-
 India
-
 Indonesia
-
 Iran, Islamic republic
-
 Iraq
-
 Ireland
-
 Israel
-
 Italy
-
 Jamaica
-
 Japan
-
 Jordan
-
 Kazakhstan
-
 Kenya
-
 Korea
-
 Kuwait
-
 Kyrgyzstan
-
 Laos
-
 Latvia
-
 Lebanon
-
 Lesotho
-
 Libya
-
 Lithuania
-
 Luxembourg
-
 Madagascar
-
 Malaysia
-
 Malta
-
 Mauritius
-
 Mexico
-
 Moldova
-
 Mongolia
-
 Montenegro
-
 Morocco
-
 Mozambique
-
 Myanmar
-
 Namibia
-
 Nepal
-
 Netherlands
-
 New Zealand
-
 Nigeria
-
 North Macedonia
-
 Norway
-
 Oman
-
 Pakistan
-
 Palestine
-
 Panama
-
 Papua New Guinea
-
 Paraguay
-
 Peru
-
 Philippines
-
 Poland
-
 Portugal
-
 Puerto Rico
-
 Qatar
-
 Reunion
-
 Romania
-
 Rwanda
-
 Saudi Arabia
-
 Serbia
-
 Singapore
-
 Slovakia
-
 Slovenia
-
 Somalia
-
 South Africa
-
 Spain
-
 Sri Lanka
-
 Sweden
-
 Switzerland
-
 Syria
-
 Taiwan
-
 Tajikistan
-
 Tanzania
-
 Thailand
-
 Trinidad and Tobago
-
 Tunisia
-
 Turkey
-
 UAE
-
 Uganda
-
 Ukraine
-
 United Kingdom
-
United States
-
 Uruguay
-
 Uzbekistan
-
 Venezuela
-
 Vietnam
-
 Yemen
-
 Zambia
-
 Zimbabwe
- Forex
- Crypto












