

AMD shares drop more than 3% after slipping below key moving averages and bearish technical signals

Advanced Micro Devices, Inc. (AMD) declined 3.24% as intensified short- and medium-term selling pressure dominated trading, even as the company recently reported robust revenue and substantial growth in non-GAAP operating income. The down move is reinforced by AMD falling below its short-term moving averages and a cluster of momentum signals highlighting persistent weakness.
 508.16
578.75
Highlights
- AMD reported a 50.1% increase in revenue to $11.54 billion and a 245% rise in non-GAAP operating income.
- No material regulatory actions, corporate events, or crypto-asset news were reported for the period.
- AMD stock trades below key short- and medium-term averages with sellers controlling intraday action; expected five-day range is $442.37 to $467.6.
Strong financials fail to offset persistent share price pressure
AMD reported financial results showing a 50.1% jump in revenue to $11.54 billion and a 245% gain in non-GAAP operating income. No material regulatory or corporate actions, or news related to crypto assets, were cited in the inputs. These performance highlights were accompanied by broad selling pressure in the share price.
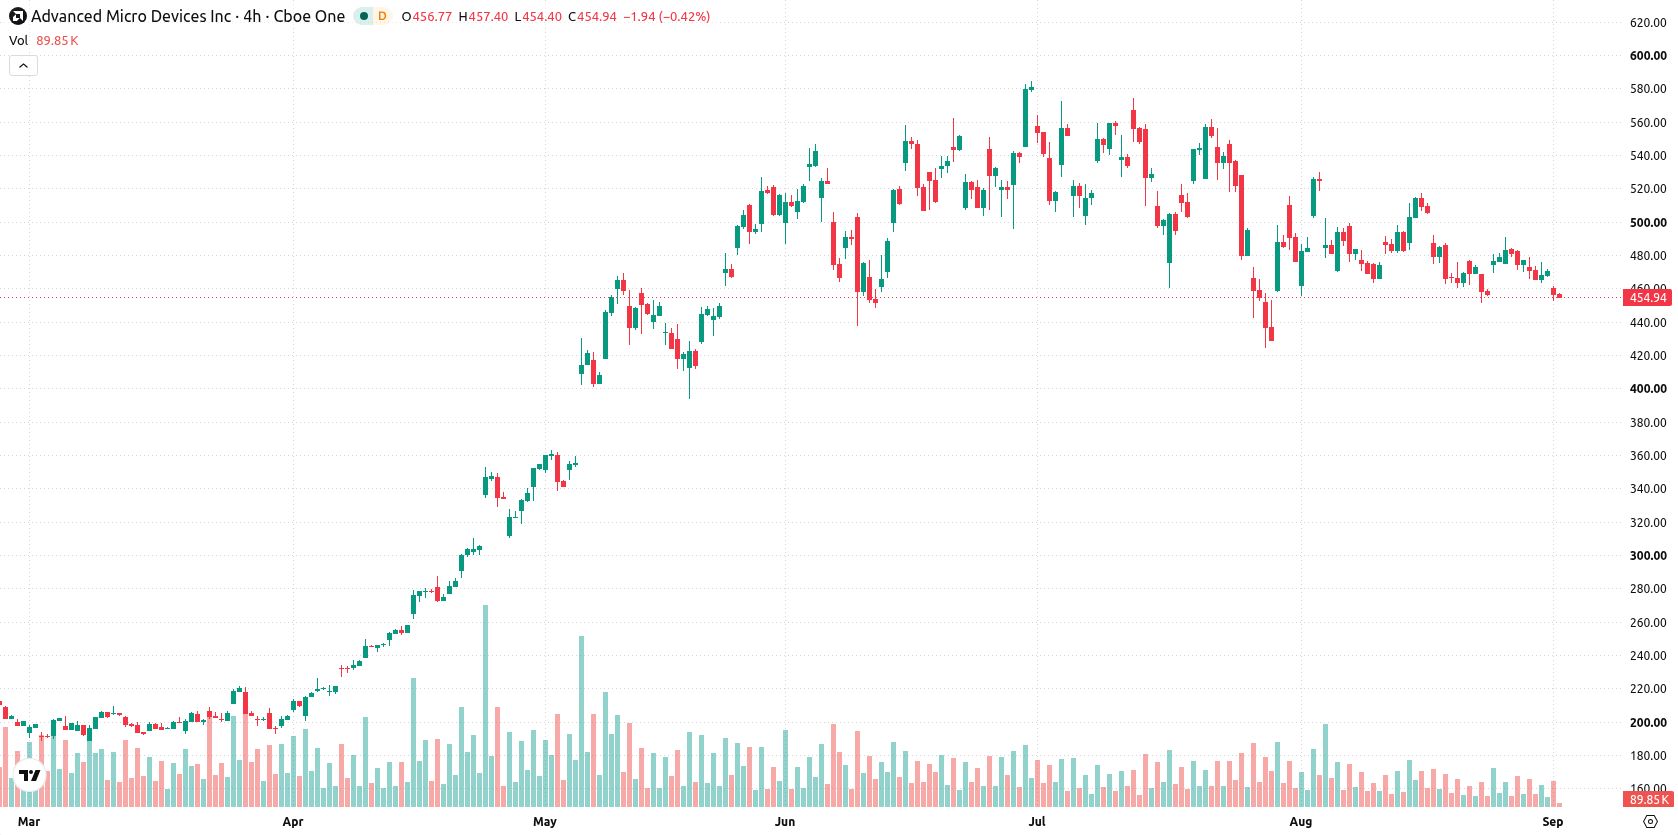
Short-term momentum weakens as price tests support and resistance
AMD trades below its 20-day ($481.2) and 50-day ($504.71) moving averages, indicating short- and medium-term pressure from sellers, but remains over the 200-day ($336.69) average, reflecting longer-term strength. The near-term ceiling stands at $465.29, serving as resistance, while initial floor support is seen at $442.37; trend confirmation from the bullish MA-50 and MA-200 alignment signals underlying upward structure over the long term. Momentum indicators highlight negative sentiment, as the Moving Average Convergence Divergence (MACD) signals sell and the Average Directional Index (ADX) remains neutral. Relative Strength Index (RSI) at 46.1 and Commodity Channel Index (CCI) at -74.97 both forecast a sell, but Stochastic RSI turns higher with a buy signal, showing some short-term recovery interest. Bull/Bear Power (BBP) at -4.59 confirms sellers clearly dominate intraday action, accompanied by an oversold alert, and the Awesome Oscillator (AO) remains neutral. The stock fell $15.24 or 3.24% on the day and opened with a downside gap of roughly $1.47 (0.31%), with the current price sitting near the session low and intraday volatility at 1.39%. Momentum signals confirm the downside tone, and intraday price action shows persistent pressure after the open.
Previously it was reported that AMD’s robust financial performance was being overshadowed by persistent selling pressure and mixed technical momentum, leaving the stock vulnerable to downside movement despite strong fundamentals. The latest trading signals confirm ongoing short- and medium-term weakness, highlighting $467.6 as a key resistance level to watch for any potential reversal.






Latest AMD News





-
 Afghanistan
-
 Albania
-
 Algeria
-
 Angola
-
 Argentina
-
 Armenia
-
 Australia
-
 Austria
-
 Azerbaijan
-
 Bahamas
-
 Bahrain
-
 Bangladesh
-
 Belarus
-
 Belgium
-
 Bolivia
-
 Botswana
-
 Brazil
-
 Brunei
-
 Bulgaria
-
 Cambodia
-
 Cameroon
-
 Canada
-
 Chile
-
 China
-
 Colombia
-
 Congo
-
 Costa Rica
-
 Cote d'Ivoire
-
 Croatia
-
 Cuba
-
 Cyprus
-
 Czechia
-
 DR Congo
-
 Denmark
-
 Dominican Republic
-
 Ecuador
-
 Egypt
-
 El Salvador
-
 Estonia
-
 Eswatini
-
 Ethiopia
-
 Finland
-
 France
-
 Georgia
-
 Germany
-
 Ghana
-
 Greece
-
 Haiti
-
 Hong Kong
-
 Hungary
-
 India
-
 Indonesia
-
 Iran, Islamic republic
-
 Iraq
-
 Ireland
-
 Israel
-
 Italy
-
 Jamaica
-
 Japan
-
 Jordan
-
 Kazakhstan
-
 Kenya
-
 Korea
-
 Kuwait
-
 Kyrgyzstan
-
 Laos
-
 Latvia
-
 Lebanon
-
 Lesotho
-
 Libya
-
 Lithuania
-
 Luxembourg
-
 Madagascar
-
 Malaysia
-
 Malta
-
 Mauritius
-
 Mexico
-
 Moldova
-
 Mongolia
-
 Montenegro
-
 Morocco
-
 Mozambique
-
 Myanmar
-
 Namibia
-
 Nepal
-
 Netherlands
-
 New Zealand
-
 Nigeria
-
 North Macedonia
-
 Norway
-
 Oman
-
 Pakistan
-
 Palestine
-
 Panama
-
 Papua New Guinea
-
 Paraguay
-
 Peru
-
 Philippines
-
 Poland
-
 Portugal
-
 Puerto Rico
-
 Qatar
-
 Reunion
-
 Romania
-
 Rwanda
-
 Saudi Arabia
-
 Serbia
-
 Singapore
-
 Slovakia
-
 Slovenia
-
 Somalia
-
 South Africa
-
 Spain
-
 Sri Lanka
-
 Sweden
-
 Switzerland
-
 Syria
-
 Taiwan
-
 Tajikistan
-
 Tanzania
-
 Thailand
-
 Trinidad and Tobago
-
 Tunisia
-
 Turkey
-
 UAE
-
 Uganda
-
 Ukraine
-
 United Kingdom
-
United States
-
 Uruguay
-
 Uzbekistan
-
 Venezuela
-
 Vietnam
-
 Yemen
-
 Zambia
-
 Zimbabwe
- Forex
- Crypto












