

Berkshire Hathaway shares stalls below resistance: weekly analysis

Shares of Berkshire Hathaway Inc. (BRK.B) are trading near $502 as the chart shows a persistent holding pattern below key resistance. Signals remain mixed heading into the week, with momentum readings providing few clear cues and the stock consolidating above support, leaving traders waiting for a definitive breakout or breakdown.
 595.07
596.23
Highlights
- Shares of Berkshire Hathaway slipped $3.04 in the past week to $502.44, consolidating in a tight trading range.
- Technical indicators signal a neutral to overbought setup, with mixed momentum and volatility at 1.42%.
- The stock is expected to trade between $499.26 and $516.96, with support at $502.2 and resistance at $506.75.
Robust operating earnings and acquisitions drive capital allocation shifts this week
Berkshire reported strong second quarter operating earnings, up 16% to $12.98 billion, alongside $4.5 billion in share buybacks, according to ad-hoc-news.de. In the same quarter, the company sharply boosted external stock purchases to $23.5 billion and increased its stake in Alphabet by 83%, now valued near $38 billion, as reflected in MoneyCheck and Yahoo Finance. Cash holdings dropped to $364.7 billion. Additionally, Seeking Alpha confirmed Berkshire completed its $6.8 billion acquisition of homebuilder Taylor Morrison on July 24, 2026.
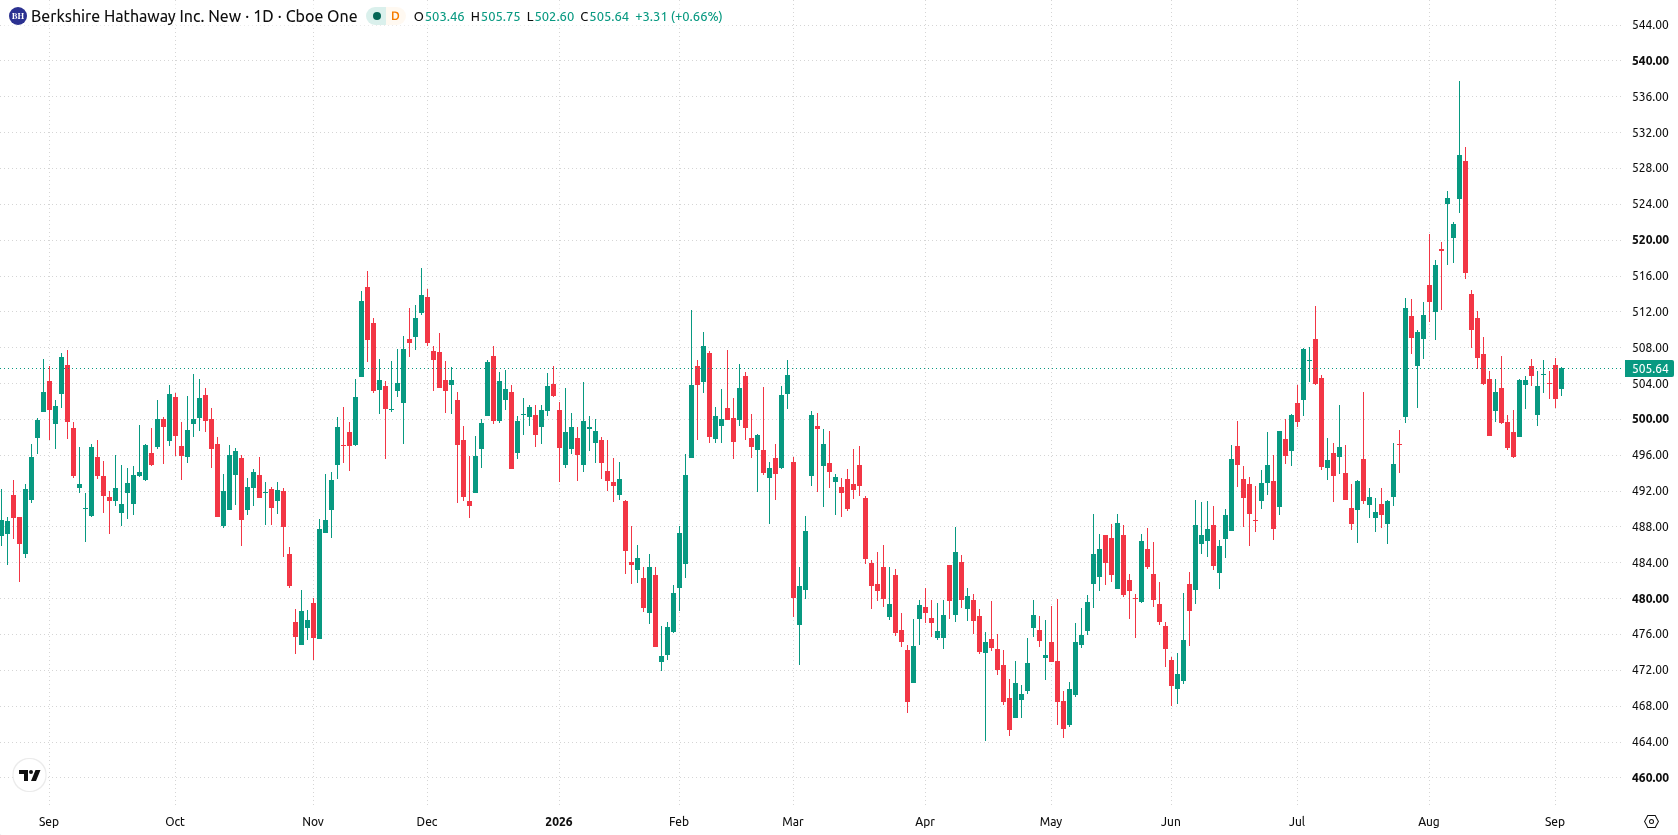
Neutral momentum and narrow range define technical posture over the week
The daily chart reflects consolidation, with the move contained within a narrow range and volatility at 1.42%. Momentum signals are mixed: MACD and ADX both offer neutral reads, while Bull/Bear Power shows an overbought bias. Immediate support is found at $502.2, where the price is holding at the MA-50, and resistance stands at $506.75 from the recent weekly high. This structure points to a holding pattern around current levels, with no clear trend emerging in the short term.
Downside risk edges higher as consolidation expected in the coming week
For the coming trading week, the expected range is $499.26 to $516.96, with a 44% probability of an increase and a 56% probability of a decrease. Base case sees the stock consolidating between support at $502.2 and resistance at $506.75. A push above $506.75 could test the upper bound toward $516.72, while a sustained move below $502.2 would open up downside risk toward the lower edge of the range.
Earlier, analysts noted that Berkshire Hathaway's shares were lagging the broader market amid leadership transition uncertainty and shifting portfolio allocations. The latest consolidation in BRK.B reflects an ongoing wait for clear directional cues, with the key level to watch now centered at the $506.75 resistance for signs of a potential breakout.






Latest Berkshire Hathaway News





-
 Afghanistan
-
 Albania
-
 Algeria
-
 Angola
-
 Argentina
-
 Armenia
-
 Australia
-
 Austria
-
 Azerbaijan
-
 Bahamas
-
 Bahrain
-
 Bangladesh
-
 Belarus
-
 Belgium
-
 Bolivia
-
 Botswana
-
 Brazil
-
 Brunei
-
 Bulgaria
-
 Cambodia
-
 Cameroon
-
 Canada
-
 Chile
-
 China
-
 Colombia
-
 Congo
-
 Costa Rica
-
 Cote d'Ivoire
-
 Croatia
-
 Cuba
-
 Cyprus
-
 Czechia
-
 DR Congo
-
 Denmark
-
 Dominican Republic
-
 Ecuador
-
 Egypt
-
 El Salvador
-
 Estonia
-
 Eswatini
-
 Ethiopia
-
 Finland
-
 France
-
 Georgia
-
 Germany
-
 Ghana
-
 Greece
-
 Haiti
-
 Hong Kong
-
 Hungary
-
 India
-
 Indonesia
-
 Iran, Islamic republic
-
 Iraq
-
 Ireland
-
 Israel
-
 Italy
-
 Jamaica
-
 Japan
-
 Jordan
-
 Kazakhstan
-
 Kenya
-
 Korea
-
 Kuwait
-
 Kyrgyzstan
-
 Laos
-
 Latvia
-
 Lebanon
-
 Lesotho
-
 Libya
-
 Lithuania
-
 Luxembourg
-
 Madagascar
-
 Malaysia
-
 Malta
-
 Mauritius
-
 Mexico
-
 Moldova
-
 Mongolia
-
 Montenegro
-
 Morocco
-
 Mozambique
-
 Myanmar
-
 Namibia
-
 Nepal
-
 Netherlands
-
 New Zealand
-
 Nigeria
-
 North Macedonia
-
 Norway
-
 Oman
-
 Pakistan
-
 Palestine
-
 Panama
-
 Papua New Guinea
-
 Paraguay
-
 Peru
-
 Philippines
-
 Poland
-
 Portugal
-
 Puerto Rico
-
 Qatar
-
 Reunion
-
 Romania
-
 Rwanda
-
 Saudi Arabia
-
 Serbia
-
 Singapore
-
 Slovakia
-
 Slovenia
-
 Somalia
-
 South Africa
-
 Spain
-
 Sri Lanka
-
 Sweden
-
 Switzerland
-
 Syria
-
 Taiwan
-
 Tajikistan
-
 Tanzania
-
 Thailand
-
 Trinidad and Tobago
-
 Tunisia
-
 Turkey
-
 UAE
-
 Uganda
-
 Ukraine
-
 United Kingdom
-
United States
-
 Uruguay
-
 Uzbekistan
-
 Venezuela
-
 Vietnam
-
 Yemen
-
 Zambia
-
 Zimbabwe
- Forex
- Crypto












