

Berkshire Hathaway stock weekly forecast: Price tests $588.39 resistance as bullish momentum persists

Shares of Berkshire Hathaway Inc. (BRK.B) are trading near $588 as the stock rallied roughly 3% higher over the past week, but now confronts the challenge of overbought conditions. With robust buying interest driving the advance, investors face a test of whether the rally can extend or if a pause is due in the coming sessions.
 595.07
596.23
Highlights
- Shares of Berkshire Hathaway have gained 3% over the past week and last traded at $588.21.
- The stock maintains a bullish trend, trading above key moving averages with overbought momentum signals and high volatility.
- Over the coming week, price is forecast to consolidate or extend between $576.61 and $604.65, with correction risk below $562.46.
Share repurchases hit record as weaker insurance income curbs sentiment
Berkshire reported third quarter results showing a record $9.6 billion spent on share repurchases as operating income declined, according to CNBC. Yahoo Finance noted that operating earnings fell 5.8% year-over-year to $12.7 billion, primarily due to softer performance in insurance and investment income. The company also formalized Greg Abel's position as Warren Buffett's successor following the board's decision after the results.
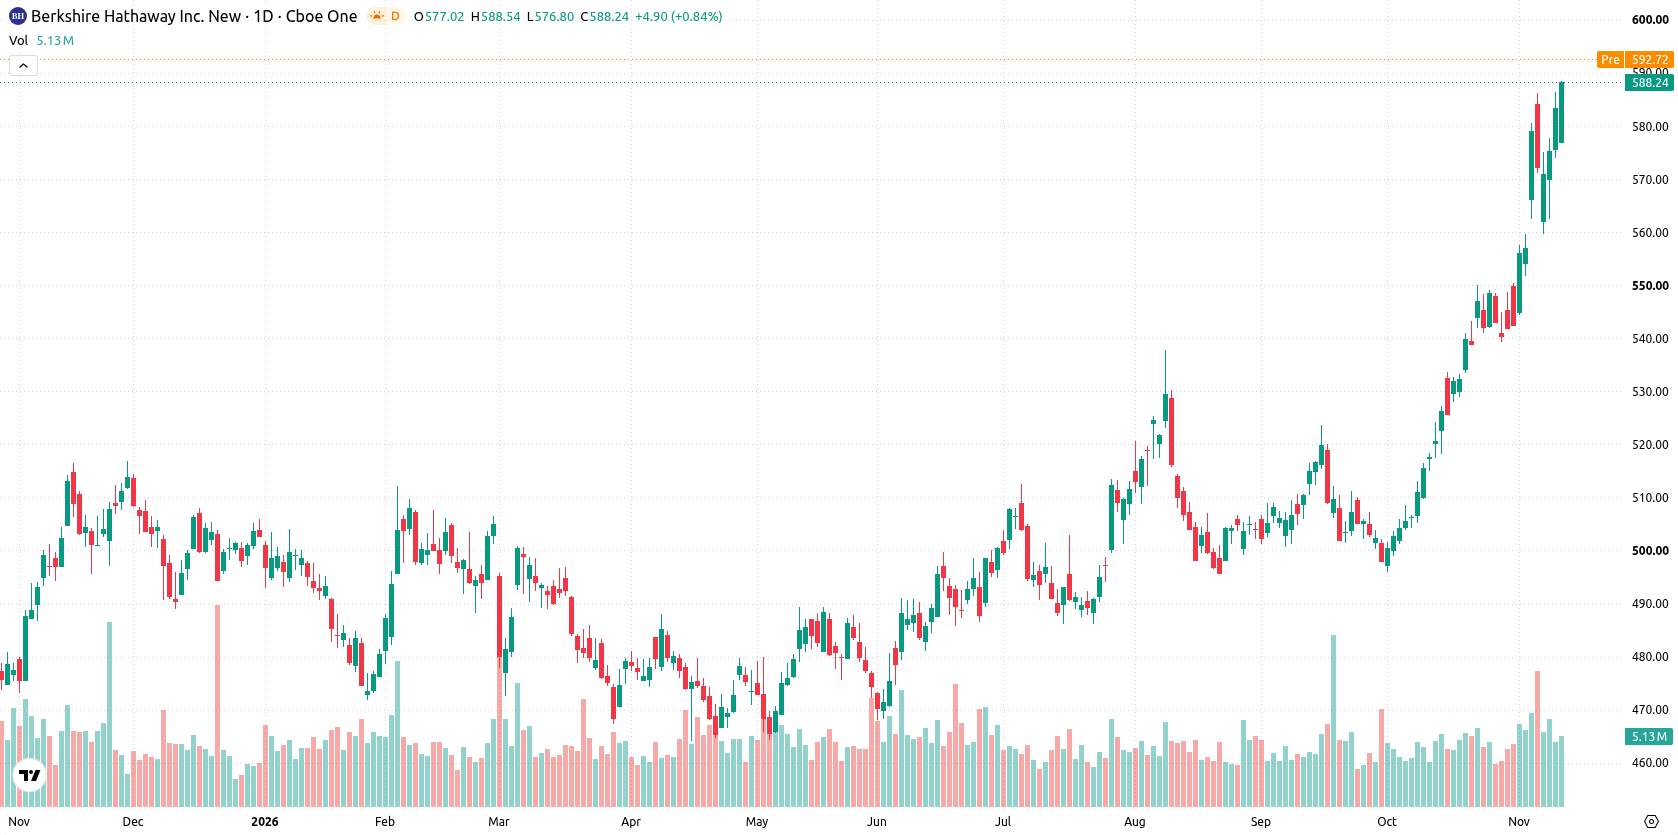
Overbought technical signals emerge as trend momentum persists this week
On the daily chart, the stock is exhibiting a sustained move higher with a firm trend, supported by high trend indicators and 4.61% volatility over the past week. Both RSI and CCI are registering overbought readings at 79.13 and 136.53 respectively, signaling possible correction risk despite the current momentum, while ADX confirms trend strength. The price is pinned to its weekly resistance at $588.39, with nearest support at $562.46 and the Ichimoku Kijun at $545.41 still acting as a practical backup level. On the weekly chart, the longer-term picture stays firmly constructive.
Range-bound optimism prevails as breakout risk grows for next week
Over the coming trading week, the expected range is $576.61 to $604.65, with a very high probability of an increase and a very low probability of a decrease. The base case favors consolidation or extension inside this range. A bullish break above $588.39 opens the path toward $604.65, while a bearish scenario would need the stock to slip below $562.46 to signal correction risk.
Previously it was reported that Berkshire Hathaway accelerated share buybacks under Greg Abel even as insurance sector weakness weighed on operating profits. The current technical outlook adds a new dimension by highlighting near-term overbought readings and a potential inflection point, with traders advised to monitor $588.39 as the key breakout level for direction in the coming sessions.






Latest Berkshire Hathaway News





-
 Afghanistan
-
 Albania
-
 Algeria
-
 Angola
-
 Argentina
-
 Armenia
-
 Australia
-
 Austria
-
 Azerbaijan
-
 Bahamas
-
 Bahrain
-
 Bangladesh
-
 Belarus
-
 Belgium
-
 Bolivia
-
 Botswana
-
 Brazil
-
 Brunei
-
 Bulgaria
-
 Cambodia
-
 Cameroon
-
 Canada
-
 Chile
-
 China
-
 Colombia
-
 Congo
-
 Costa Rica
-
 Cote d'Ivoire
-
 Croatia
-
 Cuba
-
 Cyprus
-
 Czechia
-
 DR Congo
-
 Denmark
-
 Dominican Republic
-
 Ecuador
-
 Egypt
-
 El Salvador
-
 Estonia
-
 Eswatini
-
 Ethiopia
-
 Finland
-
 France
-
 Georgia
-
 Germany
-
 Ghana
-
 Greece
-
 Haiti
-
 Hong Kong
-
 Hungary
-
 India
-
 Indonesia
-
 Iran, Islamic republic
-
 Iraq
-
 Ireland
-
 Israel
-
 Italy
-
 Jamaica
-
 Japan
-
 Jordan
-
 Kazakhstan
-
 Kenya
-
 Korea
-
 Kuwait
-
 Kyrgyzstan
-
 Laos
-
 Latvia
-
 Lebanon
-
 Lesotho
-
 Libya
-
 Lithuania
-
 Luxembourg
-
 Madagascar
-
 Malaysia
-
 Malta
-
 Mauritius
-
 Mexico
-
 Moldova
-
 Mongolia
-
 Montenegro
-
 Morocco
-
 Mozambique
-
 Myanmar
-
 Namibia
-
 Nepal
-
 Netherlands
-
 New Zealand
-
 Nigeria
-
 North Macedonia
-
 Norway
-
 Oman
-
 Pakistan
-
 Palestine
-
 Panama
-
 Papua New Guinea
-
 Paraguay
-
 Peru
-
 Philippines
-
 Poland
-
 Portugal
-
 Puerto Rico
-
 Qatar
-
 Reunion
-
 Romania
-
 Rwanda
-
 Saudi Arabia
-
 Serbia
-
 Singapore
-
 Slovakia
-
 Slovenia
-
 Somalia
-
 South Africa
-
 Spain
-
 Sri Lanka
-
 Sweden
-
 Switzerland
-
 Syria
-
 Taiwan
-
 Tajikistan
-
 Tanzania
-
 Thailand
-
 Trinidad and Tobago
-
 Tunisia
-
 Turkey
-
 UAE
-
 Uganda
-
 Ukraine
-
 United Kingdom
-
United States
-
 Uruguay
-
 Uzbekistan
-
 Venezuela
-
 Vietnam
-
 Yemen
-
 Zambia
-
 Zimbabwe
- Forex
- Crypto












