

RIOT climbs around 5.5% after renewed buying on technical oversold levels

Riot Platforms, Inc. (RIOT) surged 5.42% in a strong intraday rebound, driven by technical oversold conditions and renewed buying as sellers exhausted near key support. The move looks limited, with RIOT still trading below both its 20-day and 50-day moving averages and strong resistance overhead.
 17.12
17.12
Highlights
- Riot Platforms stock trades below key short- and medium-term moving averages but stays above its 200-day average, indicating ongoing seller pressure with longer-term trend still positive.
- Momentum and oscillator signals are uniformly negative, indicating the stock is oversold with weak trend conviction and persistent selling pressure.
- Price is expected to consolidate between $16.68 and $20.84 over the next five sessions, with a high probability of a downward move unless shares clear $19.95 resistance.
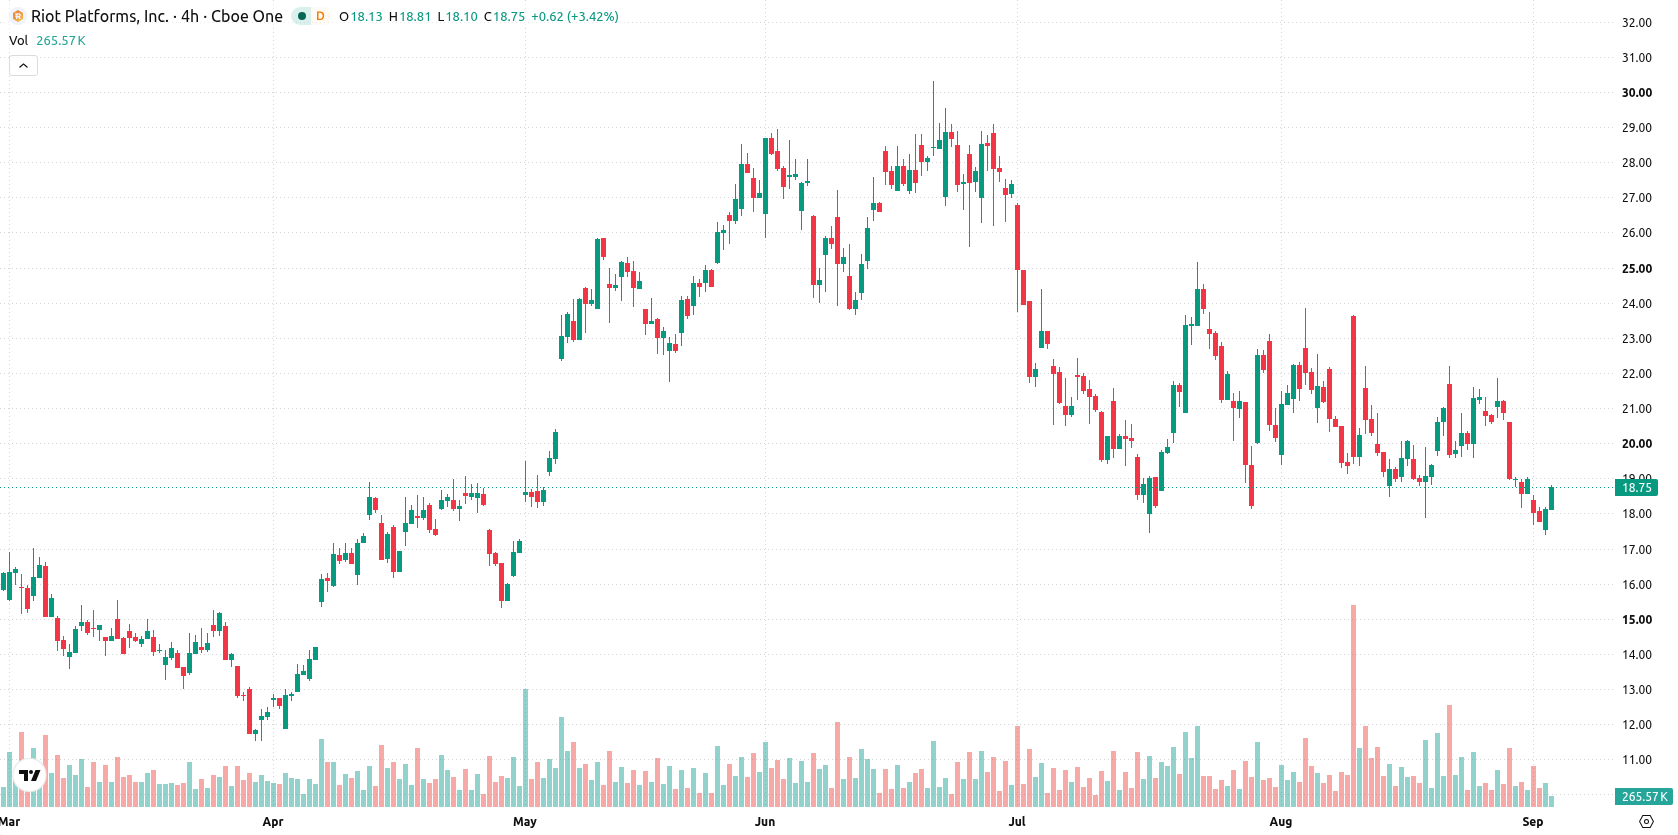
Weak momentum and resistance cap recovery despite oversold signals
RIOT is trading below its 20-day and 50-day moving averages at $19.95 and $21.51, but remains above the 200-day average at $18.56. This dynamic reveals persistent short- and medium-term selling pressure, although the broader trend remains constructive. The immediate resistance level stands at $19.95, with support at $18.56, and the Ichimoku Kijun at $20.76 adds another cap overhead. Momentum signals remain weak, as the MACD is negative and signals a sell, ADX is low at 9.5 reflecting a lack of trend strength, and RSI at 39.51, CCI at -159.5, Stochastic RSI at 0, and BBP at -1.15 all indicate oversold conditions. The Awesome Oscillator also forecasts a sell, confirming that sellers dominate intraday momentum. Despite today's move toward session highs, oscillators continue to reflect a mixed technical picture.
Earlier, analysts noted that Riot Platforms faced sustained technical weakness and elevated downside risk. New momentum readings reinforce this cautious outlook, with traders advised to closely monitor the $18.56 support level for signs of further downside acceleration in the sessions ahead.









-
 Afghanistan
-
 Albania
-
 Algeria
-
 Angola
-
 Argentina
-
 Armenia
-
 Australia
-
 Austria
-
 Azerbaijan
-
 Bahamas
-
 Bahrain
-
 Bangladesh
-
 Belarus
-
 Belgium
-
 Bolivia
-
 Botswana
-
 Brazil
-
 Brunei
-
 Bulgaria
-
 Cambodia
-
 Cameroon
-
 Canada
-
 Chile
-
 China
-
 Colombia
-
 Congo
-
 Costa Rica
-
 Cote d'Ivoire
-
 Croatia
-
 Cuba
-
 Cyprus
-
 Czechia
-
 DR Congo
-
 Denmark
-
 Dominican Republic
-
 Ecuador
-
 Egypt
-
 El Salvador
-
 Estonia
-
 Eswatini
-
 Ethiopia
-
 Finland
-
 France
-
 Georgia
-
 Germany
-
 Ghana
-
 Greece
-
 Haiti
-
 Hong Kong
-
 Hungary
-
 India
-
 Indonesia
-
 Iran, Islamic republic
-
 Iraq
-
 Ireland
-
 Israel
-
 Italy
-
 Jamaica
-
 Japan
-
 Jordan
-
 Kazakhstan
-
 Kenya
-
 Korea
-
 Kuwait
-
 Kyrgyzstan
-
 Laos
-
 Latvia
-
 Lebanon
-
 Lesotho
-
 Libya
-
 Lithuania
-
 Luxembourg
-
 Madagascar
-
 Malaysia
-
 Malta
-
 Mauritius
-
 Mexico
-
 Moldova
-
 Mongolia
-
 Montenegro
-
 Morocco
-
 Mozambique
-
 Myanmar
-
 Namibia
-
 Nepal
-
 Netherlands
-
 New Zealand
-
 Nigeria
-
 North Macedonia
-
 Norway
-
 Oman
-
 Pakistan
-
 Palestine
-
 Panama
-
 Papua New Guinea
-
 Paraguay
-
 Peru
-
 Philippines
-
 Poland
-
 Portugal
-
 Puerto Rico
-
 Qatar
-
 Reunion
-
 Romania
-
 Rwanda
-
 Saudi Arabia
-
 Serbia
-
 Singapore
-
 Slovakia
-
 Slovenia
-
 Somalia
-
 South Africa
-
 Spain
-
 Sri Lanka
-
 Sweden
-
 Switzerland
-
 Syria
-
 Taiwan
-
 Tajikistan
-
 Tanzania
-
 Thailand
-
 Trinidad and Tobago
-
 Tunisia
-
 Turkey
-
 UAE
-
 Uganda
-
 Ukraine
-
 United Kingdom
-
United States
-
 Uruguay
-
 Uzbekistan
-
 Venezuela
-
 Vietnam
-
 Yemen
-
 Zambia
-
 Zimbabwe
- Forex
- Crypto












