


JetBlue Airways Corp (JBLU) rebounded 3.73% in an intraday recovery driven by deeply oversold signals and ongoing selling pressure. The rebound looks limited, with the stock still trading below its major moving averages and facing persistent overhead resistance.
 3.84
4.09
Highlights
- JetBlue Airways stock trades below short, medium, and long-term moving averages, indicating downward pressure across all timeframes.
- Momentum and breadth indicators display oversold conditions and weak trend alignment, with sellers dominating the recent sessions.
- Expected five-day price range is $4.35 to $4.92, with a very high probability of a move below $4.53 toward $4.35.
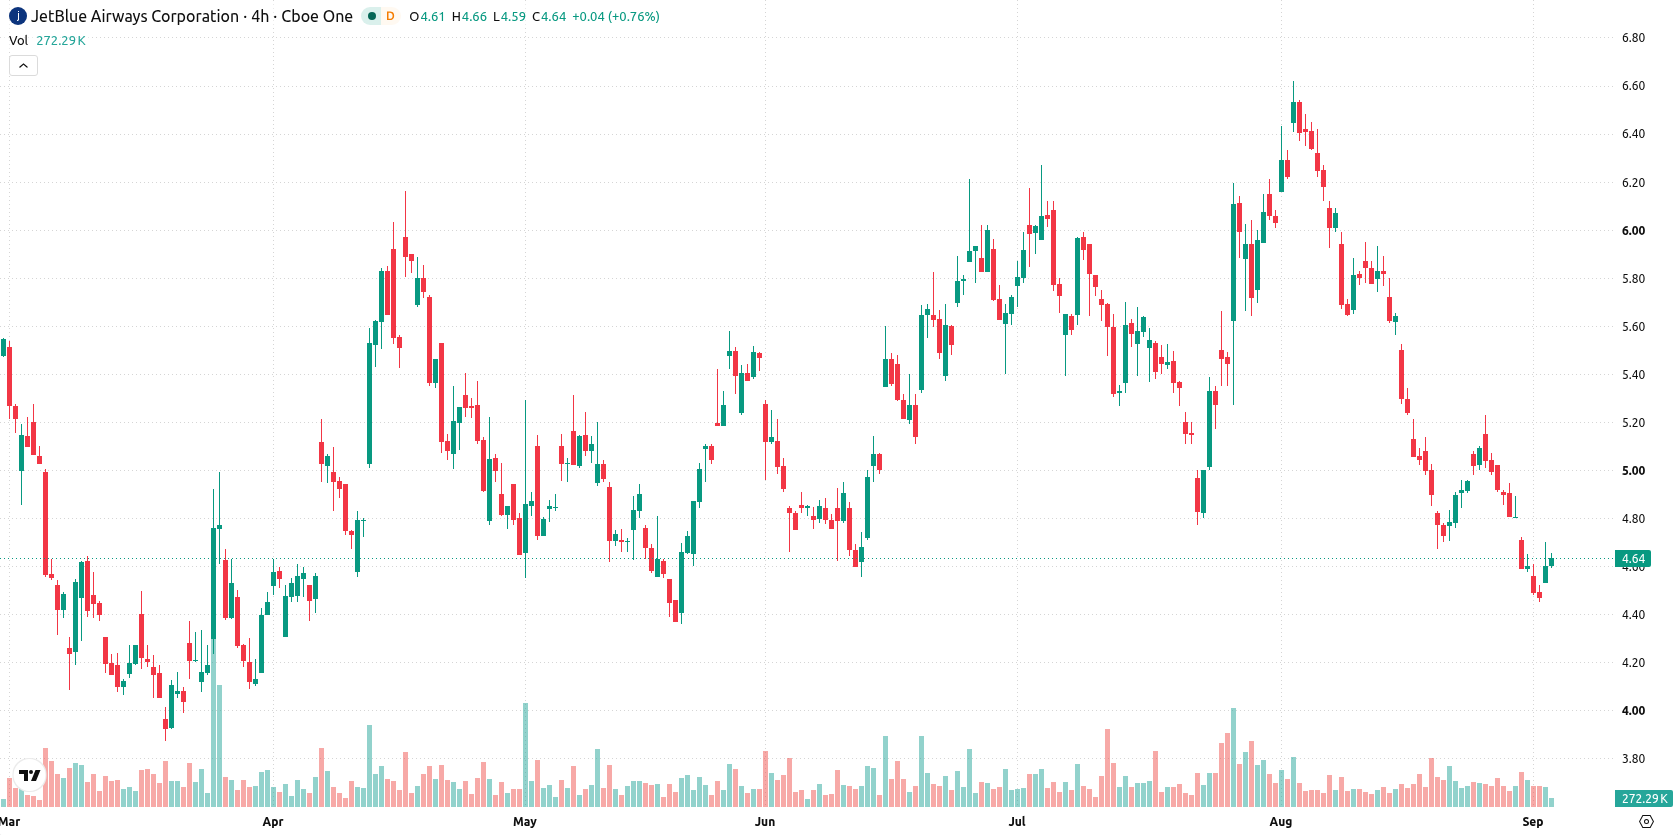
Bearish momentum persists as long-term signals offset technical oversold
JetBlue Airways remains below the $5.3 (MA-20), $5.54 (MA-50), and $5.1 (MA-200) moving averages, indicating short, medium, and long-term downward pressure. The immediate trading range is capped by resistance at $4.7 and finds support at $4.53, with distant overhead resistance levels confirming the prevailing bearish structure, even though the MA-50 vs MA-200 alignment is bullish for the long term. Momentum signals show weakness, with the MACD at sell and the ADX reflecting a neutral trend. The RSI is deeply oversold at 31.66, joined by oversold readings from both the Stochastic RSI and CCI. The BBP is negative at -0.37, showing sellers continue to dominate intraday and also indicating an oversold condition. The Awesome Oscillator also signals selling pressure in line with the prevailing momentum. Intraday volatility stands at 3.75%. The stock is showing modest strength off the lows but remains under pressure with sellers dictating the overall tone.
Earlier, analysts noted continued bearish pressure on JetBlue Airways stock emphasizing that downside risks remained prevalent amid persistent selling. The latest analysis reinforces this outlook, highlighting that the prevailing scenario calls for vigilance around the $4.53 support level as a break below it could expose the stock to additional downside within the projected volatility band.









-
 Afghanistan
-
 Albania
-
 Algeria
-
 Angola
-
 Argentina
-
 Armenia
-
 Australia
-
 Austria
-
 Azerbaijan
-
 Bahamas
-
 Bahrain
-
 Bangladesh
-
 Belarus
-
 Belgium
-
 Bolivia
-
 Botswana
-
 Brazil
-
 Brunei
-
 Bulgaria
-
 Cambodia
-
 Cameroon
-
 Canada
-
 Chile
-
 China
-
 Colombia
-
 Congo
-
 Costa Rica
-
 Cote d'Ivoire
-
 Croatia
-
 Cuba
-
 Cyprus
-
 Czechia
-
 DR Congo
-
 Denmark
-
 Dominican Republic
-
 Ecuador
-
 Egypt
-
 El Salvador
-
 Estonia
-
 Eswatini
-
 Ethiopia
-
 Finland
-
 France
-
 Georgia
-
 Germany
-
 Ghana
-
 Greece
-
 Haiti
-
 Hong Kong
-
 Hungary
-
 India
-
 Indonesia
-
 Iran, Islamic republic
-
 Iraq
-
 Ireland
-
 Israel
-
 Italy
-
 Jamaica
-
 Japan
-
 Jordan
-
 Kazakhstan
-
 Kenya
-
 Korea
-
 Kuwait
-
 Kyrgyzstan
-
 Laos
-
 Latvia
-
 Lebanon
-
 Lesotho
-
 Libya
-
 Lithuania
-
 Luxembourg
-
 Madagascar
-
 Malaysia
-
 Malta
-
 Mauritius
-
 Mexico
-
 Moldova
-
 Mongolia
-
 Montenegro
-
 Morocco
-
 Mozambique
-
 Myanmar
-
 Namibia
-
 Nepal
-
 Netherlands
-
 New Zealand
-
 Nigeria
-
 North Macedonia
-
 Norway
-
 Oman
-
 Pakistan
-
 Palestine
-
 Panama
-
 Papua New Guinea
-
 Paraguay
-
 Peru
-
 Philippines
-
 Poland
-
 Portugal
-
 Puerto Rico
-
 Qatar
-
 Reunion
-
 Romania
-
 Rwanda
-
 Saudi Arabia
-
 Serbia
-
 Singapore
-
 Slovakia
-
 Slovenia
-
 Somalia
-
 South Africa
-
 Spain
-
 Sri Lanka
-
 Sweden
-
 Switzerland
-
 Syria
-
 Taiwan
-
 Tajikistan
-
 Tanzania
-
 Thailand
-
 Trinidad and Tobago
-
 Tunisia
-
 Turkey
-
 UAE
-
 Uganda
-
 Ukraine
-
 United Kingdom
-
United States
-
 Uruguay
-
 Uzbekistan
-
 Venezuela
-
 Vietnam
-
 Yemen
-
 Zambia
-
 Zimbabwe
- Forex
- Crypto












