

Will JetBlue Airways stock hold above $3.88 support amid oversold technical signals?

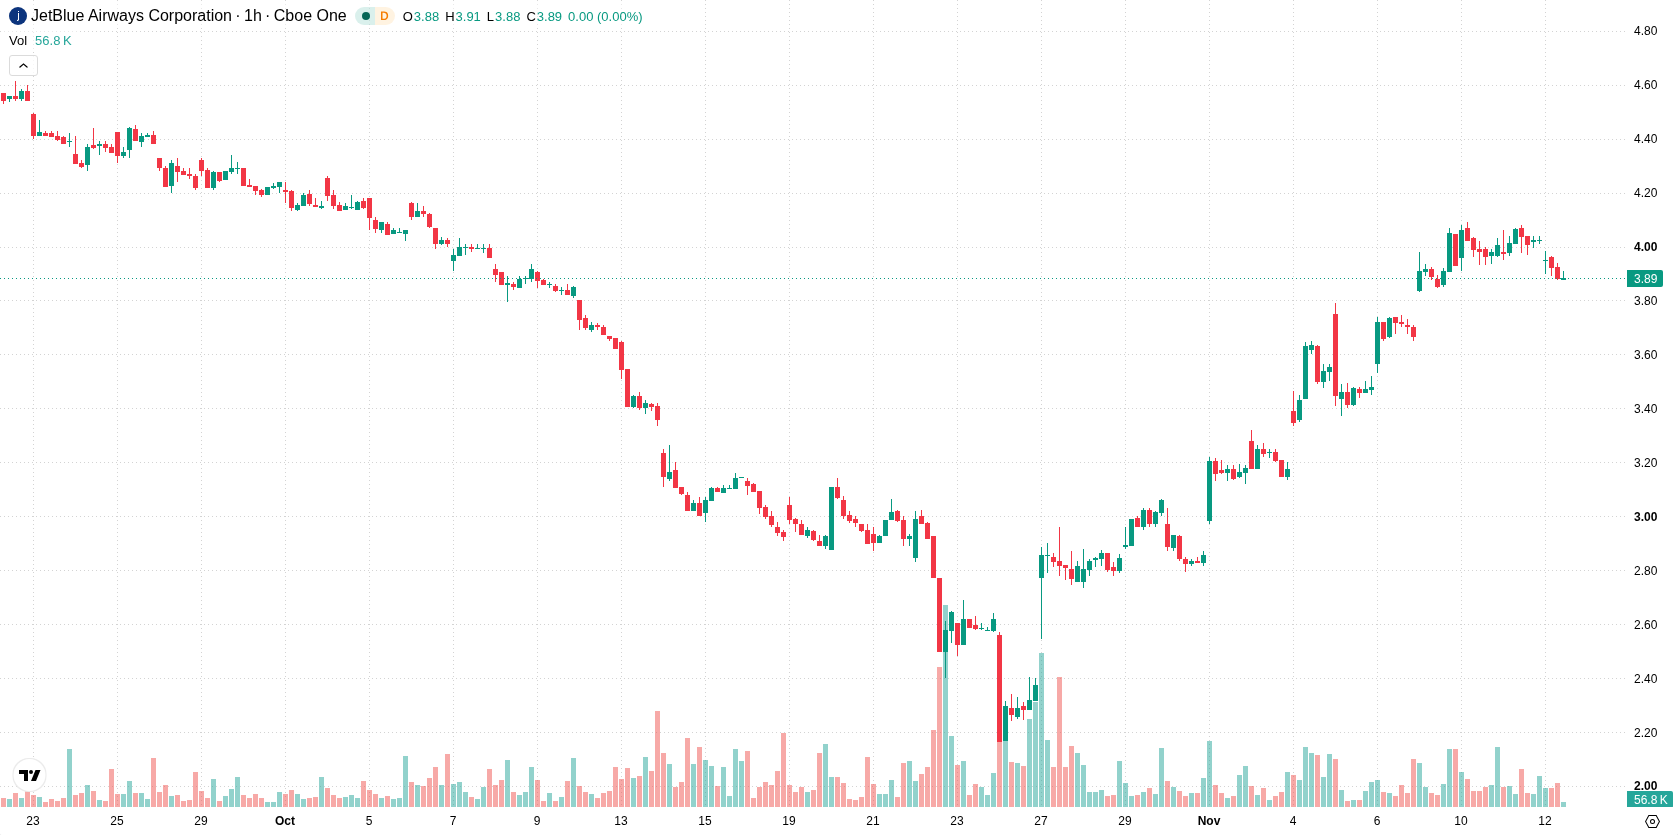
JetBlue Airways (JBLU) stock is trading at $3.88, down 3.48% for the day with a negative gap of $0.07. The shares sit below their short-term moving average but above the medium-term mark, reflecting short-term weakness and some medium-term support.
 3.68
3.82
Highlights
- JetBlue Airways debuted BlueFirst, a new domestic first-class product, as its largest move to boost profitability.
- JetBlue reported a third-quarter net loss of $257 million because of higher fuel expenses and faces ongoing operational difficulties.
- Shares of JetBlue trade below key moving averages with mixed technical signals, expected to oscillate between $3.63 and $4.13 in the coming days.
Premium product rollout drives revenue focus amid persistent operational hurdles
JetBlue Airways unveiled its new domestic first-class product, BlueFirst, at John F. Kennedy International Airport in New York as part of its largest initiative toward returning to profitability, according to CNBC. This high-profile launch highlights a shift toward premium offerings and signals management’s focus on organic revenue improvements rather than restructuring, which CEO Joanna Geraghty confirmed by stating there is no need for reorganization, as reported by Seeking Alpha. However, ongoing operational challenges remain evident after JetBlue posted a third-quarter net loss of $257 million, primarily due to higher fuel costs, as highlighted by Investing.com, and the recent lender cooperation agreement reflects deepening debt-related caution.
Bullish momentum and oversold signals highlight choppy technical environment
JBLU trades below its MA-20 but above its MA-50, confirming short-term weakness with medium-term support. The price remains well under the MA-200, underscoring a bearish long-term setup, while the Ichimoku Kijun level at $3.88 marks immediate support. On the indicator front, MACD shows a strong buy signal and ADX suggests active buying strength. RSI is neutral, while Stoch RSI and CCI both indicate oversold conditions. Bull/Bear Power is slightly negative, suggesting mild seller dominance intraday, and the Awesome Oscillator remains neutral. Mixed signals between oversold oscillators and bullish momentum highlight near-term indecision.
Range-bound price outlook as volatility shapes direction risk
In the short term, JBLU is expected to trade within the $3.63 to $4.13 range, reflecting typical volatility relative to current levels. Statistically, there is a 64% probability of an upward move and a 36% chance of downside. The base scenario involves oscillation within this range, with a move above resistance pointing to a bullish case, while a breakdown of support could signal an extension of the current weakness.
Earlier, analysts noted that while JetBlue Airways showed improved short-term momentum, it continued to contend with persistent financial and technical headwinds. The latest developments introduce a renewed focus on organic revenue initiatives but, given continued operational challenges and mixed technical signals, traders should watch for a decisive move above or below the $3.88 Ichimoku Kijun support level to clarify near-term direction.









-
 Afghanistan
-
 Albania
-
 Algeria
-
 Angola
-
 Argentina
-
 Armenia
-
 Australia
-
 Austria
-
 Azerbaijan
-
 Bahamas
-
 Bahrain
-
 Bangladesh
-
 Belarus
-
 Belgium
-
 Bolivia
-
 Botswana
-
 Brazil
-
 Brunei
-
 Bulgaria
-
 Cambodia
-
 Cameroon
-
 Canada
-
 Chile
-
 China
-
 Colombia
-
 Congo
-
 Costa Rica
-
 Cote d'Ivoire
-
 Croatia
-
 Cuba
-
 Cyprus
-
 Czechia
-
 DR Congo
-
 Denmark
-
 Dominican Republic
-
 Ecuador
-
 Egypt
-
 El Salvador
-
 Estonia
-
 Eswatini
-
 Ethiopia
-
 Finland
-
 France
-
 Georgia
-
 Germany
-
 Ghana
-
 Greece
-
 Haiti
-
 Hong Kong
-
 Hungary
-
 India
-
 Indonesia
-
 Iran, Islamic republic
-
 Iraq
-
 Ireland
-
 Israel
-
 Italy
-
 Jamaica
-
 Japan
-
 Jordan
-
 Kazakhstan
-
 Kenya
-
 Korea
-
 Kuwait
-
 Kyrgyzstan
-
 Laos
-
 Latvia
-
 Lebanon
-
 Lesotho
-
 Libya
-
 Lithuania
-
 Luxembourg
-
 Madagascar
-
 Malaysia
-
 Malta
-
 Mauritius
-
 Mexico
-
 Moldova
-
 Mongolia
-
 Montenegro
-
 Morocco
-
 Mozambique
-
 Myanmar
-
 Namibia
-
 Nepal
-
 Netherlands
-
 New Zealand
-
 Nigeria
-
 North Macedonia
-
 Norway
-
 Oman
-
 Pakistan
-
 Palestine
-
 Panama
-
 Papua New Guinea
-
 Paraguay
-
 Peru
-
 Philippines
-
 Poland
-
 Portugal
-
 Puerto Rico
-
 Qatar
-
 Reunion
-
 Romania
-
 Rwanda
-
 Saudi Arabia
-
 Serbia
-
 Singapore
-
 Slovakia
-
 Slovenia
-
 Somalia
-
 South Africa
-
 Spain
-
 Sri Lanka
-
 Sweden
-
 Switzerland
-
 Syria
-
 Taiwan
-
 Tajikistan
-
 Tanzania
-
 Thailand
-
 Trinidad and Tobago
-
 Tunisia
-
 Turkey
-
 UAE
-
 Uganda
-
 Ukraine
-
 United Kingdom
-
United States
-
 Uruguay
-
 Uzbekistan
-
 Venezuela
-
 Vietnam
-
 Yemen
-
 Zambia
-
 Zimbabwe
- Forex
- Crypto












