

Will Hims & Hers stock break $29.01 resistance as multiple securities fraud class actions filed?

Hims & Hers (HIMS) stock is trading at $28.68, registering a modest daily increase. The price sits below its key short- and medium-term moving averages, while remaining above levels tracked by longer-term trends.
 26.23
28.61
Highlights
- The Federal Trade Commission filed a lawsuit on July 29, 2026, alleging Hims & Hers engaged in improper billing and shared sensitive consumer health data.
- Hims & Hers now faces additional securities class action lawsuits and ongoing operational issues with increased credit card disputes in its weight-loss subscription segment.
- HIMS stock trades below key short- and medium-term moving averages, with negative momentum indictors and an expected price range of $26.97 to $30.39 favoring further downside.
Legal pressures mount as FTC lawsuit and billing disputes intensify
A major regulatory event for Hims & Hers emerged on July 29, 2026, when the Federal Trade Commission filed a lawsuit alleging the company engaged in improper billing and shared sensitive consumer health data, according to Globenewswire. This action created significant legal and reputational risk, leading to further securities class action lawsuits and deadline notifications for shareholders, as highlighted by Prnewswire. Operational headwinds persist, with Investing.com reporting increased credit card disputes in the weight-loss subscription segment, further reinforcing the ongoing regulatory and legal pressures on the business.
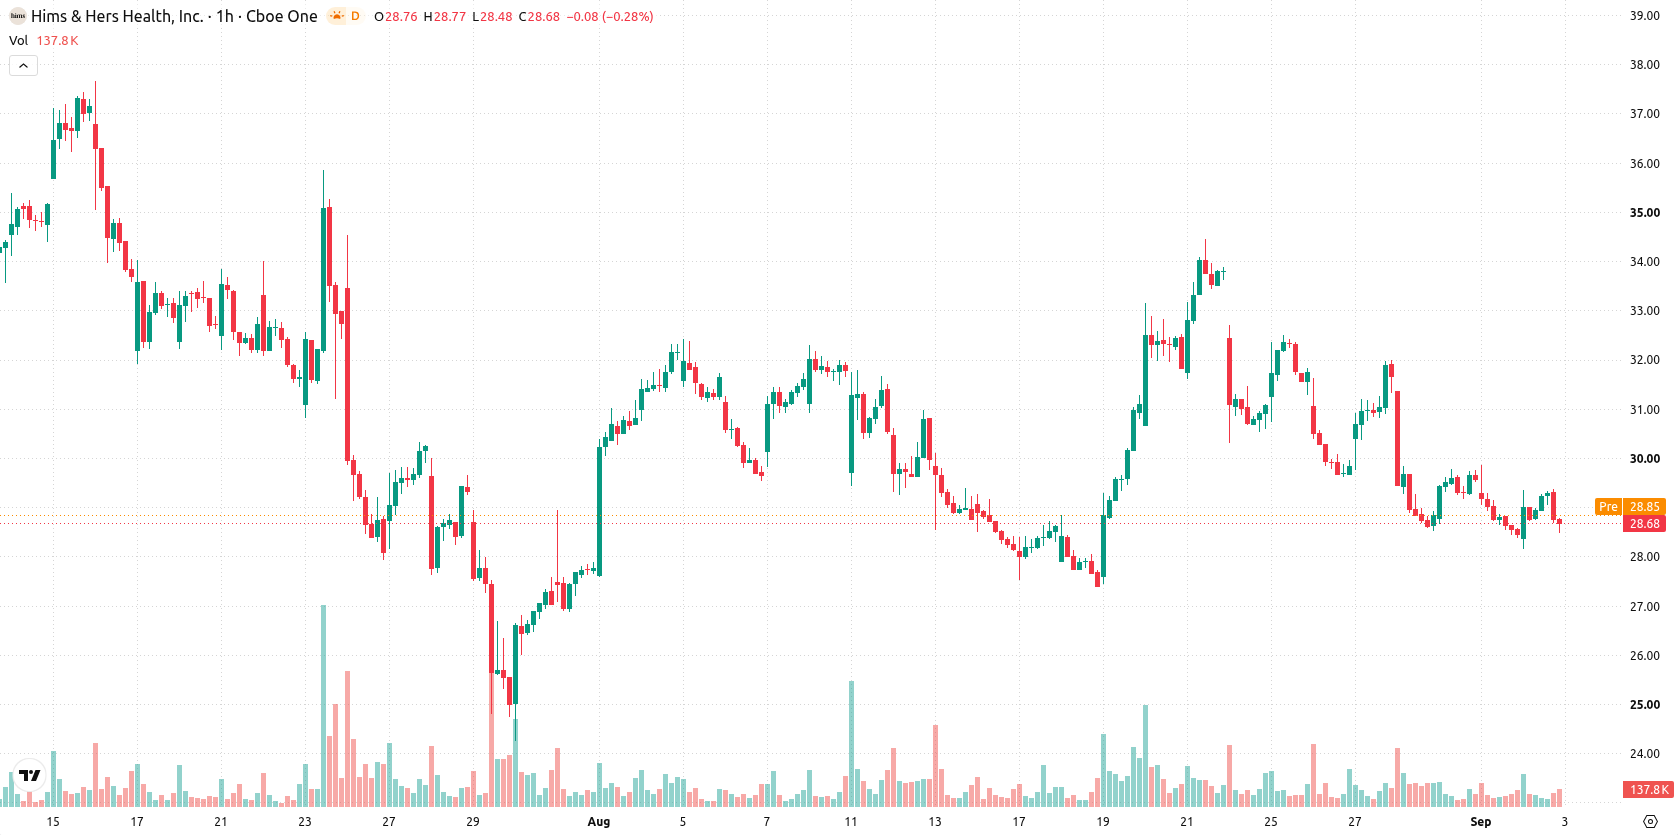
Selling momentum dominates as resistance holds below short-term averages
On the hourly chart, HIMS is trading below both the MA-20 and MA-50 but remains above the longer-term MA-200. The Ichimoku Kijun line at $29.01 serves as near-term resistance, with price action currently capped beneath this level. Key support stands at $26.97, while resistance sits at $30.39. Among technical indicators, MACD is at Strong Sell, ADX signals a neutral but unstable trend, and both RSI and CCI reflect ongoing selling pressure. Stochastic RSI and the Awesome Oscillator remain neutral, while Bull/Bear Power shows intraday dominance by sellers.
Downside risk prevails amid limited chance for breakout
Looking ahead to the next two to three trading days, HIMS is projected to fluctuate within a volatility band of $26.97 to $30.39. The most probable outcome is continued sideways movement inside this range, with the probability of a meaningful advance considered very low and the likelihood of a decline viewed as very high. Should HIMS break above the $29.01 resistance, a bullish scenario may unfold, while a drop below $26.97 would signal increased downside risk.
Earlier, analysts noted that persistent technical weakness in Hims & Hers shares outweighed the benefits of its international expansion, warranting caution. The latest regulatory and legal headwinds add a significant downside risk, making $26.97 a critical level for traders to monitor in the near term.






Latest Hims & Hers News





-
 Afghanistan
-
 Albania
-
 Algeria
-
 Angola
-
 Argentina
-
 Armenia
-
 Australia
-
 Austria
-
 Azerbaijan
-
 Bahamas
-
 Bahrain
-
 Bangladesh
-
 Belarus
-
 Belgium
-
 Bolivia
-
 Botswana
-
 Brazil
-
 Brunei
-
 Bulgaria
-
 Cambodia
-
 Cameroon
-
 Canada
-
 Chile
-
 China
-
 Colombia
-
 Congo
-
 Costa Rica
-
 Cote d'Ivoire
-
 Croatia
-
 Cuba
-
 Cyprus
-
 Czechia
-
 DR Congo
-
 Denmark
-
 Dominican Republic
-
 Ecuador
-
 Egypt
-
 El Salvador
-
 Estonia
-
 Eswatini
-
 Ethiopia
-
 Finland
-
 France
-
 Georgia
-
 Germany
-
 Ghana
-
 Greece
-
 Haiti
-
 Hong Kong
-
 Hungary
-
 India
-
 Indonesia
-
 Iran, Islamic republic
-
 Iraq
-
 Ireland
-
 Israel
-
 Italy
-
 Jamaica
-
 Japan
-
 Jordan
-
 Kazakhstan
-
 Kenya
-
 Korea
-
 Kuwait
-
 Kyrgyzstan
-
 Laos
-
 Latvia
-
 Lebanon
-
 Lesotho
-
 Libya
-
 Lithuania
-
 Luxembourg
-
 Madagascar
-
 Malaysia
-
 Malta
-
 Mauritius
-
 Mexico
-
 Moldova
-
 Mongolia
-
 Montenegro
-
 Morocco
-
 Mozambique
-
 Myanmar
-
 Namibia
-
 Nepal
-
 Netherlands
-
 New Zealand
-
 Nigeria
-
 North Macedonia
-
 Norway
-
 Oman
-
 Pakistan
-
 Palestine
-
 Panama
-
 Papua New Guinea
-
 Paraguay
-
 Peru
-
 Philippines
-
 Poland
-
 Portugal
-
 Puerto Rico
-
 Qatar
-
 Reunion
-
 Romania
-
 Rwanda
-
 Saudi Arabia
-
 Serbia
-
 Singapore
-
 Slovakia
-
 Slovenia
-
 Somalia
-
 South Africa
-
 Spain
-
 Sri Lanka
-
 Sweden
-
 Switzerland
-
 Syria
-
 Taiwan
-
 Tajikistan
-
 Tanzania
-
 Thailand
-
 Trinidad and Tobago
-
 Tunisia
-
 Turkey
-
 UAE
-
 Uganda
-
 Ukraine
-
 United Kingdom
-
United States
-
 Uruguay
-
 Uzbekistan
-
 Venezuela
-
 Vietnam
-
 Yemen
-
 Zambia
-
 Zimbabwe
- Forex
- Crypto












