

Riot Platforms shares technical analysis: Breakout attempt at $21.18 resistance

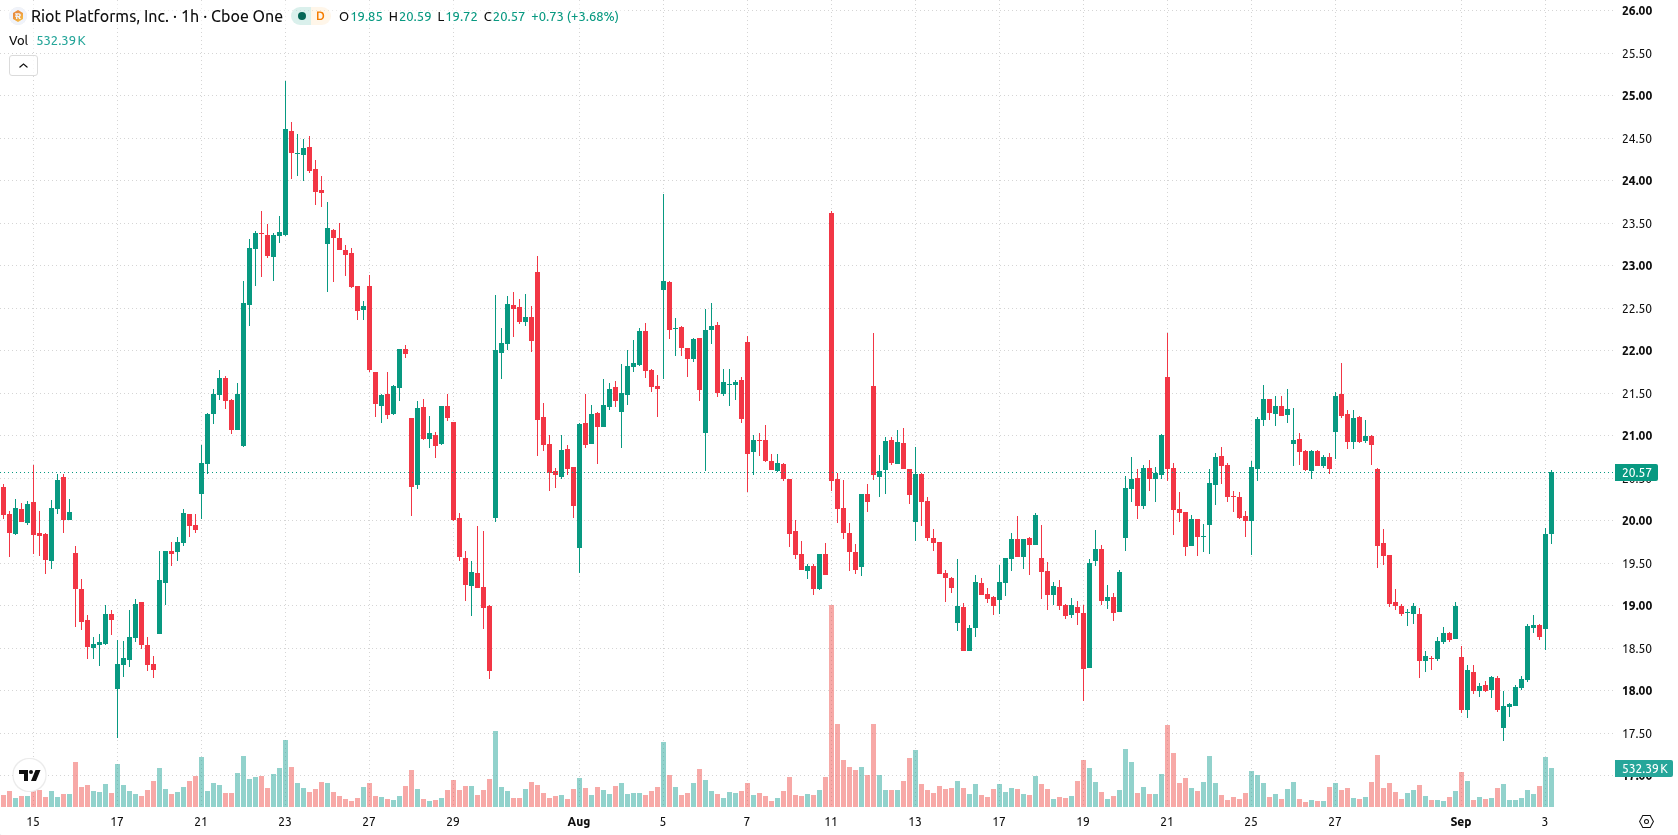
Riot Platforms (RIOT) stock is trading at $19.81 after a 6.39% gain on the day, closing near the session high. The price sits above its key moving averages, highlighting a positive alignment with recent trend dynamics.
 17.10
17.10
Highlights
- RIOT/USD trades above key moving averages across hourly and daily timeframes with short-term price action showing bullish alignment.
- Momentum indicators remain mixed, with weak momentum and overbought oscillators suggesting potential exhaustion of recent upward moves.
- Price closed at $19.81 after a 6.39% intraday surge, with the next sessions expected to range between $18.44 and $21.18 and a 64% probability of downside.
Mixed momentum emerges as buyers dominate intraday signals
On the technical front, RIOT has established support at the Ichimoku Kijun level of $18.49 and remains above the MA-20 and MA-50 on the hourly chart as well as the MA-200 on the daily timeframe. Indicator signals are mixed: MACD and ADX both continue to show sell pressure, while the Stoch RSI is overbought and the RSI sits at 49.39, which suggests selling conditions could develop due to exhaustion. The Commodity Channel Index (CCI) is delivering a buy signal, and Bull/Bear Power shows that buyers are dominant on the intraday timeframe; however, the Awesome Oscillator is neutral, reinforcing the uneven balance between price action and momentum signals.
Downside favored as volatility persists and support in focus
In the coming sessions, RIOT is expected to trade within a range of $18.44 to $21.18, reflecting its typical volatility band relative to current levels. The probabilistic scenario currently favors a downside move, with a 64% likelihood of a decline and a 36% chance of a breakout to the upside. The base case scenario sees price action remaining rangebound, with a bullish bias only emerging if resistance is taken out definitively, and a bearish outcome triggered should the price fall below immediate support.
Earlier, analysts noted that Riot Platforms was facing persistent technical weakness and elevated downside risk, advising caution as momentum remained subdued. The latest data adds a new dimension, with technical indicators presenting a mixed picture and suggesting that traders should monitor the balance between overbought and sell signals for potential volatility within the prevailing $18.44 to $21.18 range.









-
 Afghanistan
-
 Albania
-
 Algeria
-
 Angola
-
 Argentina
-
 Armenia
-
 Australia
-
 Austria
-
 Azerbaijan
-
 Bahamas
-
 Bahrain
-
 Bangladesh
-
 Belarus
-
 Belgium
-
 Bolivia
-
 Botswana
-
 Brazil
-
 Brunei
-
 Bulgaria
-
 Cambodia
-
 Cameroon
-
 Canada
-
 Chile
-
 China
-
 Colombia
-
 Congo
-
 Costa Rica
-
 Cote d'Ivoire
-
 Croatia
-
 Cuba
-
 Cyprus
-
 Czechia
-
 DR Congo
-
 Denmark
-
 Dominican Republic
-
 Ecuador
-
 Egypt
-
 El Salvador
-
 Estonia
-
 Eswatini
-
 Ethiopia
-
 Finland
-
 France
-
 Georgia
-
 Germany
-
 Ghana
-
 Greece
-
 Haiti
-
 Hong Kong
-
 Hungary
-
 India
-
 Indonesia
-
 Iran, Islamic republic
-
 Iraq
-
 Ireland
-
 Israel
-
 Italy
-
 Jamaica
-
 Japan
-
 Jordan
-
 Kazakhstan
-
 Kenya
-
 Korea
-
 Kuwait
-
 Kyrgyzstan
-
 Laos
-
 Latvia
-
 Lebanon
-
 Lesotho
-
 Libya
-
 Lithuania
-
 Luxembourg
-
 Madagascar
-
 Malaysia
-
 Malta
-
 Mauritius
-
 Mexico
-
 Moldova
-
 Mongolia
-
 Montenegro
-
 Morocco
-
 Mozambique
-
 Myanmar
-
 Namibia
-
 Nepal
-
 Netherlands
-
 New Zealand
-
 Nigeria
-
 North Macedonia
-
 Norway
-
 Oman
-
 Pakistan
-
 Palestine
-
 Panama
-
 Papua New Guinea
-
 Paraguay
-
 Peru
-
 Philippines
-
 Poland
-
 Portugal
-
 Puerto Rico
-
 Qatar
-
 Reunion
-
 Romania
-
 Rwanda
-
 Saudi Arabia
-
 Serbia
-
 Singapore
-
 Slovakia
-
 Slovenia
-
 Somalia
-
 South Africa
-
 Spain
-
 Sri Lanka
-
 Sweden
-
 Switzerland
-
 Syria
-
 Taiwan
-
 Tajikistan
-
 Tanzania
-
 Thailand
-
 Trinidad and Tobago
-
 Tunisia
-
 Turkey
-
 UAE
-
 Uganda
-
 Ukraine
-
 United Kingdom
-
United States
-
 Uruguay
-
 Uzbekistan
-
 Venezuela
-
 Vietnam
-
 Yemen
-
 Zambia
-
 Zimbabwe
- Forex
- Crypto












