

Bit Digital shares technical analysis: $1.67 resistance test draws attention

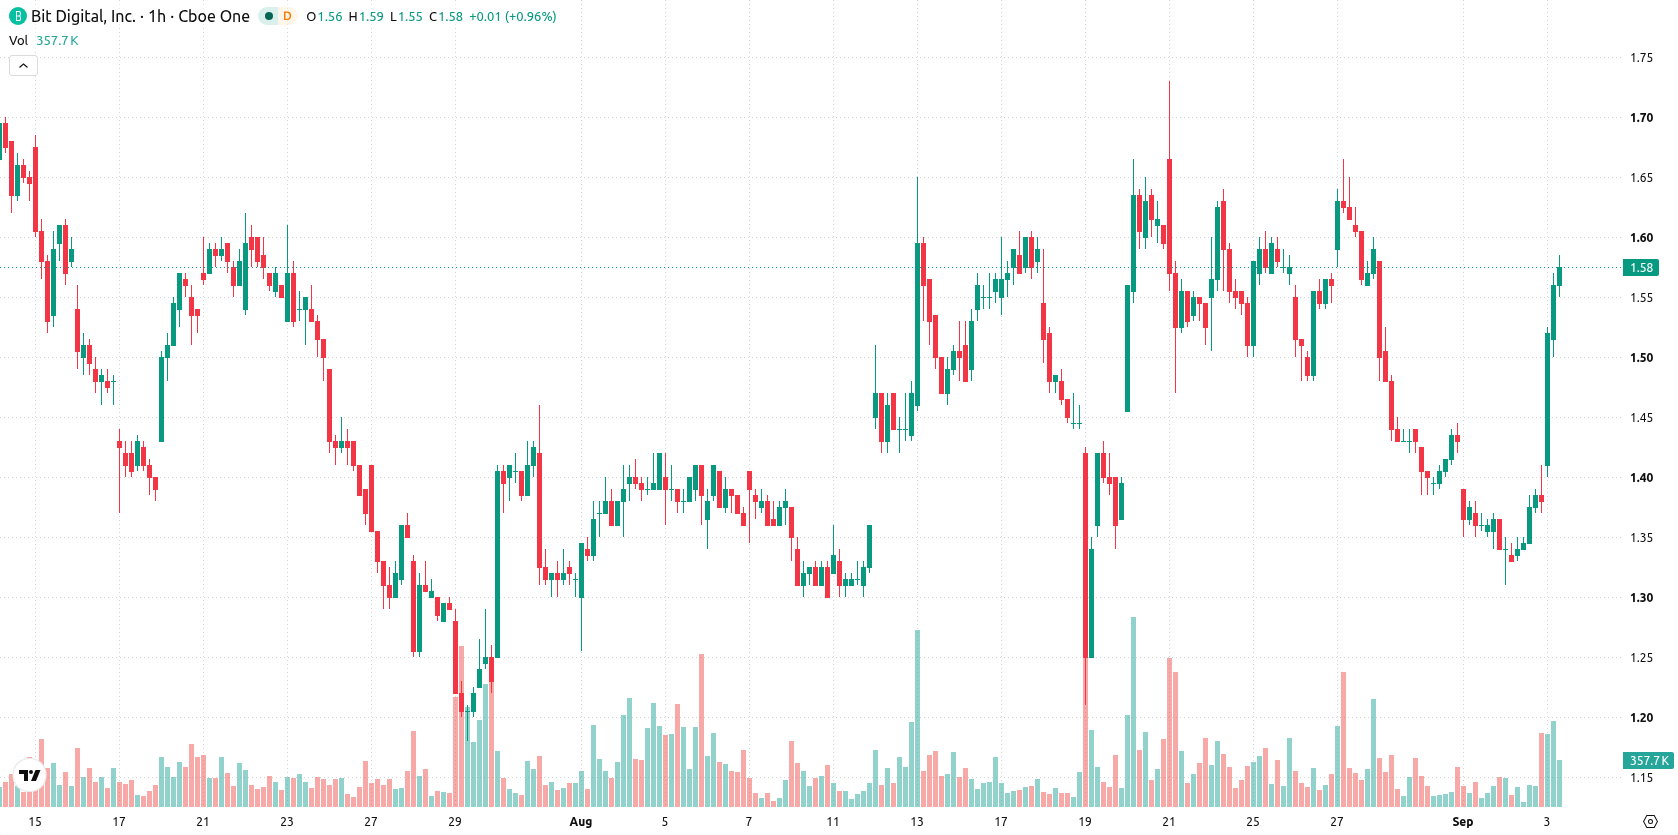
Bit Digital (BTBT) stock is trading at $1.56, gaining 12.27% on the day and ending near its session high. The price sits above its short- and medium-term moving averages, highlighting ongoing upside momentum in the short run.
 0.8620
0.9610
Highlights
- BTBT stock climbed 12.27% to $1.56 and closed near the session high, reflecting strong intraday volatility.
- Short- and medium-term momentum is positive, but longer-term trend pressure persists and key oscillators are conflicted.
- Over the next 2 to 3 sessions, BTBT stock is projected to consolidate between $1.39 and $1.67 with a 72% probability of an upward move.
Momentum uncertainty as technical indicators diverge on direction
On the H1 timeframe, BTBT is positioned above its MA-20 and MA-50, while remaining below the long-term MA-200. The immediate Ichimoku Kijun level sits at $1.41, acting as key support. Technical indicators show MACD signaling a strong sell and ADX highlighting downward momentum. RSI also indicates selling pressure, while Stoch RSI is overbought, and CCI is neutral. Bull/Bear Power shows buyers dominating intraday action, while the Awesome Oscillator remains neutral. These mixed signals, particularly the divergence between oscillators and momentum indicators, highlight uncertainty in the current setup.
Consolidation scenario favored amid breakout risks above resistance
Looking ahead to the next 2–3 sessions, the expected range for BTBT is $1.39 to $1.67, based on recent volatility. The likelihood of an upward move is elevated at 72%, with a downside probability of 28%. The baseline scenario calls for price consolidation within this corridor. Should BTBT break through resistance at $1.67, further gains could follow, while a drop below support at $1.41 would raise the risk of a broader pullback within the projected band.
In a recent review, analysts highlighted persistent bearish momentum and technical resistance for Bit Digital. The current setup introduces mixed signals and heightened volatility, so traders should closely monitor the $1.41 support level, as a breakdown here could trigger a broader technical retracement.






Latest Bit Digital News



-
 Afghanistan
-
 Albania
-
 Algeria
-
 Angola
-
 Argentina
-
 Armenia
-
 Australia
-
 Austria
-
 Azerbaijan
-
 Bahamas
-
 Bahrain
-
 Bangladesh
-
 Belarus
-
 Belgium
-
 Bolivia
-
 Botswana
-
 Brazil
-
 Brunei
-
 Bulgaria
-
 Cambodia
-
 Cameroon
-
 Canada
-
 Chile
-
 China
-
 Colombia
-
 Congo
-
 Costa Rica
-
 Cote d'Ivoire
-
 Croatia
-
 Cuba
-
 Cyprus
-
 Czechia
-
 DR Congo
-
 Denmark
-
 Dominican Republic
-
 Ecuador
-
 Egypt
-
 El Salvador
-
 Estonia
-
 Eswatini
-
 Ethiopia
-
 Finland
-
 France
-
 Georgia
-
 Germany
-
 Ghana
-
 Greece
-
 Haiti
-
 Hong Kong
-
 Hungary
-
 India
-
 Indonesia
-
 Iran, Islamic republic
-
 Iraq
-
 Ireland
-
 Israel
-
 Italy
-
 Jamaica
-
 Japan
-
 Jordan
-
 Kazakhstan
-
 Kenya
-
 Korea
-
 Kuwait
-
 Kyrgyzstan
-
 Laos
-
 Latvia
-
 Lebanon
-
 Lesotho
-
 Libya
-
 Lithuania
-
 Luxembourg
-
 Madagascar
-
 Malaysia
-
 Malta
-
 Mauritius
-
 Mexico
-
 Moldova
-
 Mongolia
-
 Montenegro
-
 Morocco
-
 Mozambique
-
 Myanmar
-
 Namibia
-
 Nepal
-
 Netherlands
-
 New Zealand
-
 Nigeria
-
 North Macedonia
-
 Norway
-
 Oman
-
 Pakistan
-
 Palestine
-
 Panama
-
 Papua New Guinea
-
 Paraguay
-
 Peru
-
 Philippines
-
 Poland
-
 Portugal
-
 Puerto Rico
-
 Qatar
-
 Reunion
-
 Romania
-
 Rwanda
-
 Saudi Arabia
-
 Serbia
-
 Singapore
-
 Slovakia
-
 Slovenia
-
 Somalia
-
 South Africa
-
 Spain
-
 Sri Lanka
-
 Sweden
-
 Switzerland
-
 Syria
-
 Taiwan
-
 Tajikistan
-
 Tanzania
-
 Thailand
-
 Trinidad and Tobago
-
 Tunisia
-
 Turkey
-
 UAE
-
 Uganda
-
 Ukraine
-
 United Kingdom
-
United States
-
 Uruguay
-
 Uzbekistan
-
 Venezuela
-
 Vietnam
-
 Yemen
-
 Zambia
-
 Zimbabwe
- Forex
- Crypto












