

What's behind Bit Digital's latest 13.7% stock surge?

Bit Digital Inc (BTBT) surged 13.72% as technical momentum and a strong upside gap encouraged buying. The advance looks limited, with the price still below its 200-day moving average and the long-term trend context remaining bearish.
 0.8300
0.9610
Highlights
- Bit Digital stock trades above short- and medium-term moving averages but remains below the key long-term level, confirming a bearish overall trend.
- Technical signals are mixed with MACD and RSI forecasting a sell, while Stochastic RSI and Hull Moving Average indicate potential buying pressure from oversold conditions.
- Shares trade near resistance at $1.71 with a high probability of moving down to $1.39 in the next five days.
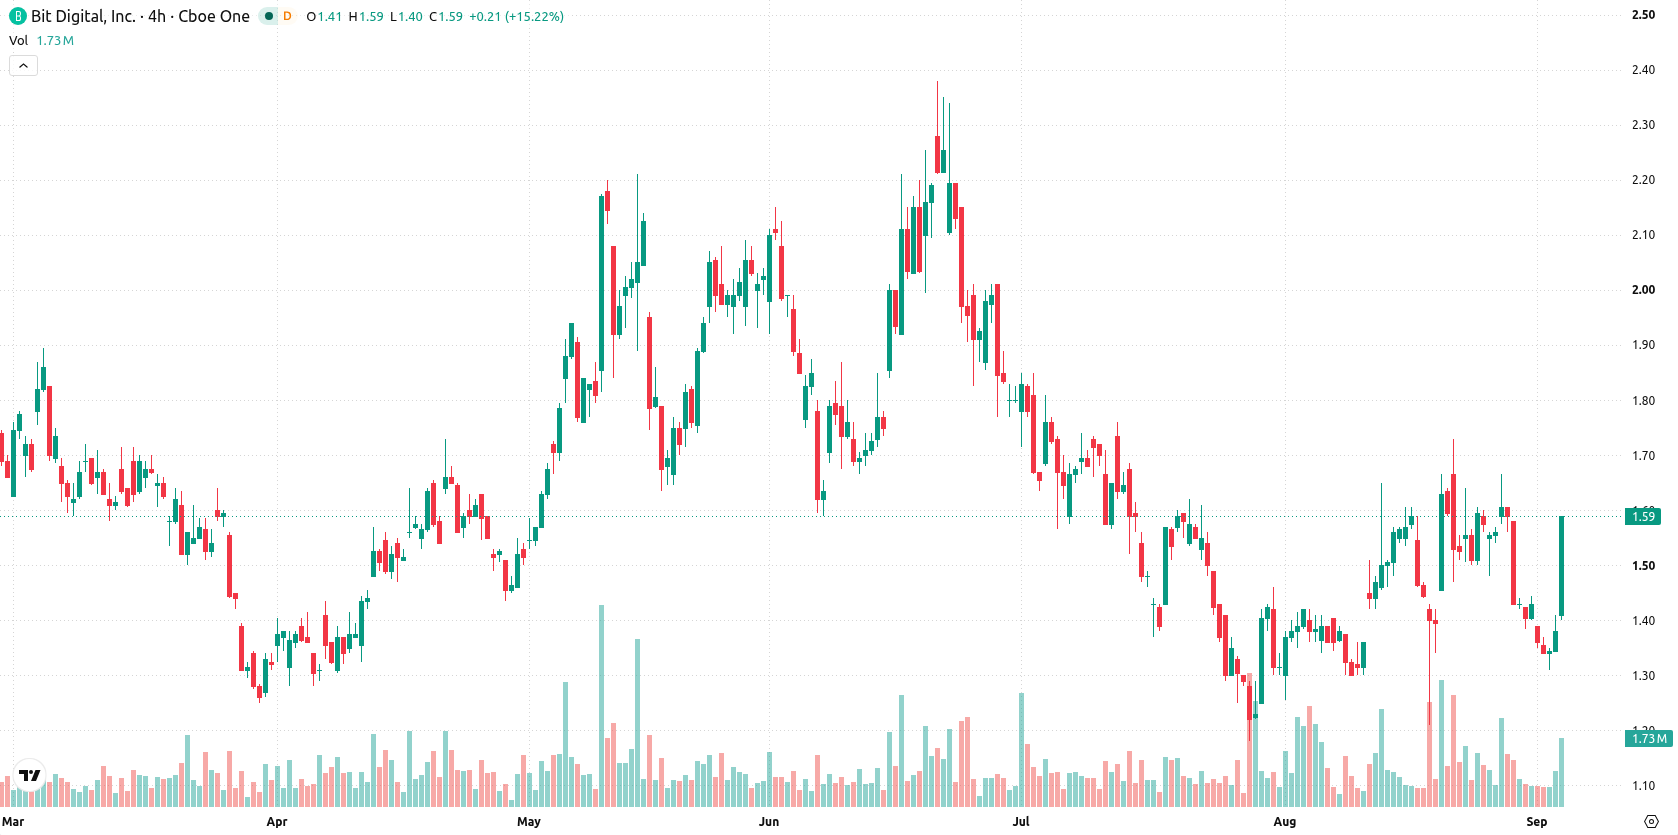
Mixed momentum and technical barriers cap short-term gains
Bit Digital is trading above its 20-day and 50-day moving averages at $1.47 and $1.53 respectively, indicating short- and medium-term improvement, but remains below the 200-day level of $1.79. Near-term support is at $1.57 and resistance is at $1.71, with the broader trend remaining bearish as shown by the 50-day versus 200-day alignment and the Ichimoku Kijun support at $1.45. Momentum signals are mixed: MACD and RSI both indicate a sell, the ADX reads neutral, and Stochastic RSI points to a strong buy from oversold conditions. CCI and BBP show sellers remain dominant intraday, though BBP is only slightly below zero and the Hull Moving Average suggests strong buy conditions. Bit Digital is trading near today's high following a 1.44% upside gap, with intraday volatility measured at 4.26%.
Earlier, analysts noted that Bit Digital faced technical uncertainty with a mixed outlook, as bullish short-term signals contrasted with a persistent bearish long-term trend. The current analysis reinforces this view, highlighting that despite a recent surge, the prevailing scenario for traders is to monitor the $1.71 resistance as the key inflection point for direction in the coming sessions.






Latest Bit Digital News



-
 Afghanistan
-
 Albania
-
 Algeria
-
 Angola
-
 Argentina
-
 Armenia
-
 Australia
-
 Austria
-
 Azerbaijan
-
 Bahamas
-
 Bahrain
-
 Bangladesh
-
 Belarus
-
 Belgium
-
 Bolivia
-
 Botswana
-
 Brazil
-
 Brunei
-
 Bulgaria
-
 Cambodia
-
 Cameroon
-
 Canada
-
 Chile
-
 China
-
 Colombia
-
 Congo
-
 Costa Rica
-
 Cote d'Ivoire
-
 Croatia
-
 Cuba
-
 Cyprus
-
 Czechia
-
 DR Congo
-
 Denmark
-
 Dominican Republic
-
 Ecuador
-
 Egypt
-
 El Salvador
-
 Estonia
-
 Eswatini
-
 Ethiopia
-
 Finland
-
 France
-
 Georgia
-
 Germany
-
 Ghana
-
 Greece
-
 Haiti
-
 Hong Kong
-
 Hungary
-
 India
-
 Indonesia
-
 Iran, Islamic republic
-
 Iraq
-
 Ireland
-
 Israel
-
 Italy
-
 Jamaica
-
 Japan
-
 Jordan
-
 Kazakhstan
-
 Kenya
-
 Korea
-
 Kuwait
-
 Kyrgyzstan
-
 Laos
-
 Latvia
-
 Lebanon
-
 Lesotho
-
 Libya
-
 Lithuania
-
 Luxembourg
-
 Madagascar
-
 Malaysia
-
 Malta
-
 Mauritius
-
 Mexico
-
 Moldova
-
 Mongolia
-
 Montenegro
-
 Morocco
-
 Mozambique
-
 Myanmar
-
 Namibia
-
 Nepal
-
 Netherlands
-
 New Zealand
-
 Nigeria
-
 North Macedonia
-
 Norway
-
 Oman
-
 Pakistan
-
 Palestine
-
 Panama
-
 Papua New Guinea
-
 Paraguay
-
 Peru
-
 Philippines
-
 Poland
-
 Portugal
-
 Puerto Rico
-
 Qatar
-
 Reunion
-
 Romania
-
 Rwanda
-
 Saudi Arabia
-
 Serbia
-
 Singapore
-
 Slovakia
-
 Slovenia
-
 Somalia
-
 South Africa
-
 Spain
-
 Sri Lanka
-
 Sweden
-
 Switzerland
-
 Syria
-
 Taiwan
-
 Tajikistan
-
 Tanzania
-
 Thailand
-
 Trinidad and Tobago
-
 Tunisia
-
 Turkey
-
 UAE
-
 Uganda
-
 Ukraine
-
 United Kingdom
-
United States
-
 Uruguay
-
 Uzbekistan
-
 Venezuela
-
 Vietnam
-
 Yemen
-
 Zambia
-
 Zimbabwe
- Forex
- Crypto












