

Can upcoming $0.14 per share dividend spark PayPal stock rally?

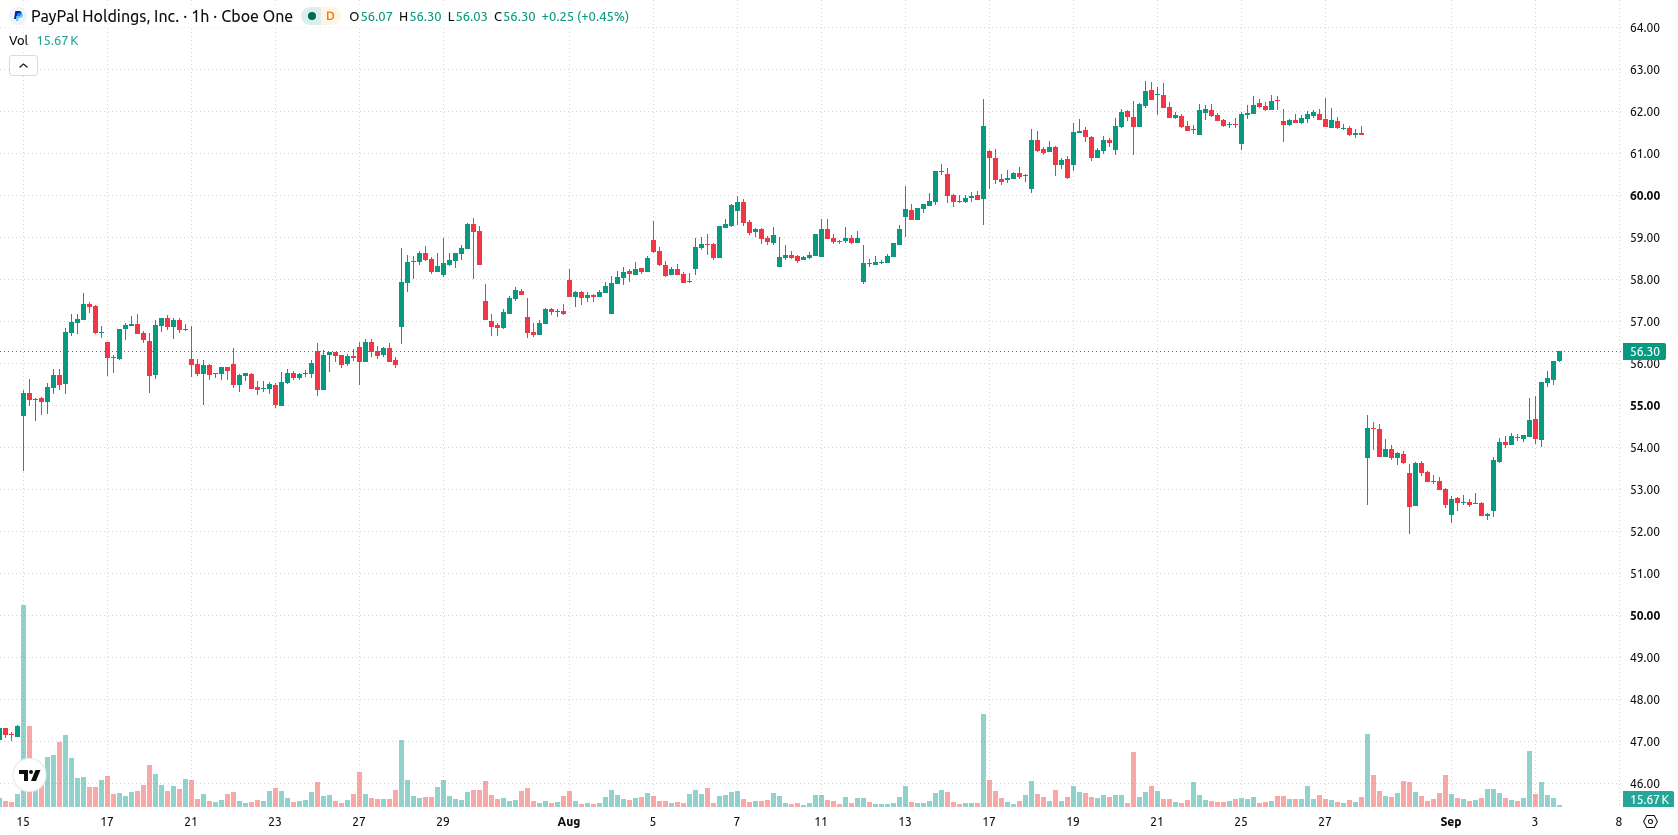
PayPal Holdings, Inc. (PYPL) stock is trading at $56.32, showing a daily gain of 3.1%. The price sits above its key short- and long-term moving averages, with only the medium-term average remaining overhead.
 59.00
59.00
Highlights
- Demand for PayPal stock has increased among income-focused traders before its scheduled $0.14 per share quarterly dividend with an ex-dividend date of September 4, 2026.
- A $53 billion buyout offer for PayPal collapsed and attention has returned to the companys valuation and core business, reinforced by cost-cutting layoffs of 600 workers in India.
- PayPal stock remains above long-term support levels with mixed technical indicators, showing range-bound potential of $55.07 to $57.57 and a higher likelihood of a downward move in the coming sessions.
Dividend demand rises as buyout collapse refocuses investor attention
Investor focus on PayPal is intensifying in advance of its upcoming ex-dividend date of September 4, 2026, with a quarterly payout of $0.14 per share, driving demand among income-oriented traders, according to Benzinga. The collapse of a potential $53 billion buyout offer has diverted attention back to PayPal’s core business and underlying fundamentals, prompting a reassessment of the company’s valuation. In addition, PayPal has initiated cost-cutting efforts with layoffs of approximately 600 employees in India, about 10% of its workforce there, as reported by Finance Yahoo, which may further support profitability moving forward.
Mixed momentum persists as price challenges technical resistance
Technically, PYPL finds immediate support at the Ichimoku Kijun around $53.5, with the price holding above both the MA-20 ($53.34) and MA-200 ($51.08), while the MA-50 overhead at $57.15 poses resistance. The short-term support and resistance range for the asset is $55.07 to $57.57. Momentum readings are mixed: MACD continues to flash a strong sell and ADX aligns with a sell bias, indicating persistent weakness in underlying momentum. Meanwhile, RSI at 50.48 suggests a neutral-to-bullish stance, and intraday indicators such as Stoch RSI, CCI, and Bull/Bear Power mark the setup as overbought and reflect dominant buyer activity.
Range-bound outlook dominates as breakout odds favor downside
In the short term, PYPL is expected to trade between $55.07 and $57.57, representing its typical volatility band. The probability model suggests a 32% chance of an upward breakout and a 68% likelihood of a downward move from current levels. The baseline expectation is for the price to remain range-bound, but a strong bullish run could push it above $57.57, while a bearish scenario would see it drop below $55.07 toward lower support.
Previously it was reported that PayPal faced operational restructuring with significant layoffs, leading to expectations of continued range-bound trading and elevated downside risks. The current setup reinforces the cautious outlook, highlighting $57.57 as a key resistance level that, if breached, could indicate a potential shift in the prevailing trading range.










-
 Afghanistan
-
 Albania
-
 Algeria
-
 Angola
-
 Argentina
-
 Armenia
-
 Australia
-
 Austria
-
 Azerbaijan
-
 Bahamas
-
 Bahrain
-
 Bangladesh
-
 Belarus
-
 Belgium
-
 Bolivia
-
 Botswana
-
 Brazil
-
 Brunei
-
 Bulgaria
-
 Cambodia
-
 Cameroon
-
 Canada
-
 Chile
-
 China
-
 Colombia
-
 Congo
-
 Costa Rica
-
 Cote d'Ivoire
-
 Croatia
-
 Cuba
-
 Cyprus
-
 Czechia
-
 DR Congo
-
 Denmark
-
 Dominican Republic
-
 Ecuador
-
 Egypt
-
 El Salvador
-
 Estonia
-
 Eswatini
-
 Ethiopia
-
 Finland
-
 France
-
 Georgia
-
 Germany
-
 Ghana
-
 Greece
-
 Haiti
-
 Hong Kong
-
 Hungary
-
 India
-
 Indonesia
-
 Iran, Islamic republic
-
 Iraq
-
 Ireland
-
 Israel
-
 Italy
-
 Jamaica
-
 Japan
-
 Jordan
-
 Kazakhstan
-
 Kenya
-
 Korea
-
 Kuwait
-
 Kyrgyzstan
-
 Laos
-
 Latvia
-
 Lebanon
-
 Lesotho
-
 Libya
-
 Lithuania
-
 Luxembourg
-
 Madagascar
-
 Malaysia
-
 Malta
-
 Mauritius
-
 Mexico
-
 Moldova
-
 Mongolia
-
 Montenegro
-
 Morocco
-
 Mozambique
-
 Myanmar
-
 Namibia
-
 Nepal
-
 Netherlands
-
 New Zealand
-
 Nigeria
-
 North Macedonia
-
 Norway
-
 Oman
-
 Pakistan
-
 Palestine
-
 Panama
-
 Papua New Guinea
-
 Paraguay
-
 Peru
-
 Philippines
-
 Poland
-
 Portugal
-
 Puerto Rico
-
 Qatar
-
 Reunion
-
 Romania
-
 Rwanda
-
 Saudi Arabia
-
 Serbia
-
 Singapore
-
 Slovakia
-
 Slovenia
-
 Somalia
-
 South Africa
-
 Spain
-
 Sri Lanka
-
 Sweden
-
 Switzerland
-
 Syria
-
 Taiwan
-
 Tajikistan
-
 Tanzania
-
 Thailand
-
 Trinidad and Tobago
-
 Tunisia
-
 Turkey
-
 UAE
-
 Uganda
-
 Ukraine
-
 United Kingdom
-
United States
-
 Uruguay
-
 Uzbekistan
-
 Venezuela
-
 Vietnam
-
 Yemen
-
 Zambia
-
 Zimbabwe
- Forex
- Crypto












