

Symbotic stock gains about 3.5% after renewed intraday buying and mixed technical indicators

Symbotic Inc (SYM) surged 3.49% today on a burst of short-term buying interest and renewed upward momentum, as technical conditions dominate in the absence of fresh company news. The uptrend looks limited by Symbotic remaining below its 50-day and 200-day moving averages, which points to continued medium- and long-term resistance against further gains.
 34.45
36.35
Highlights
- Symbotic stock is trading above its 20-day moving average but remains below key medium- and long-term averages, indicating persistent seller pressure.
- Momentum indicators show mixed signals, with most forecasting bearish or oversold conditions and only a few suggesting a possible near-term rebound.
- The stock is expected to trade between $39.31 and $43.21 over the next five sessions, with a 65% chance of downside and baseline sideways action near current levels.
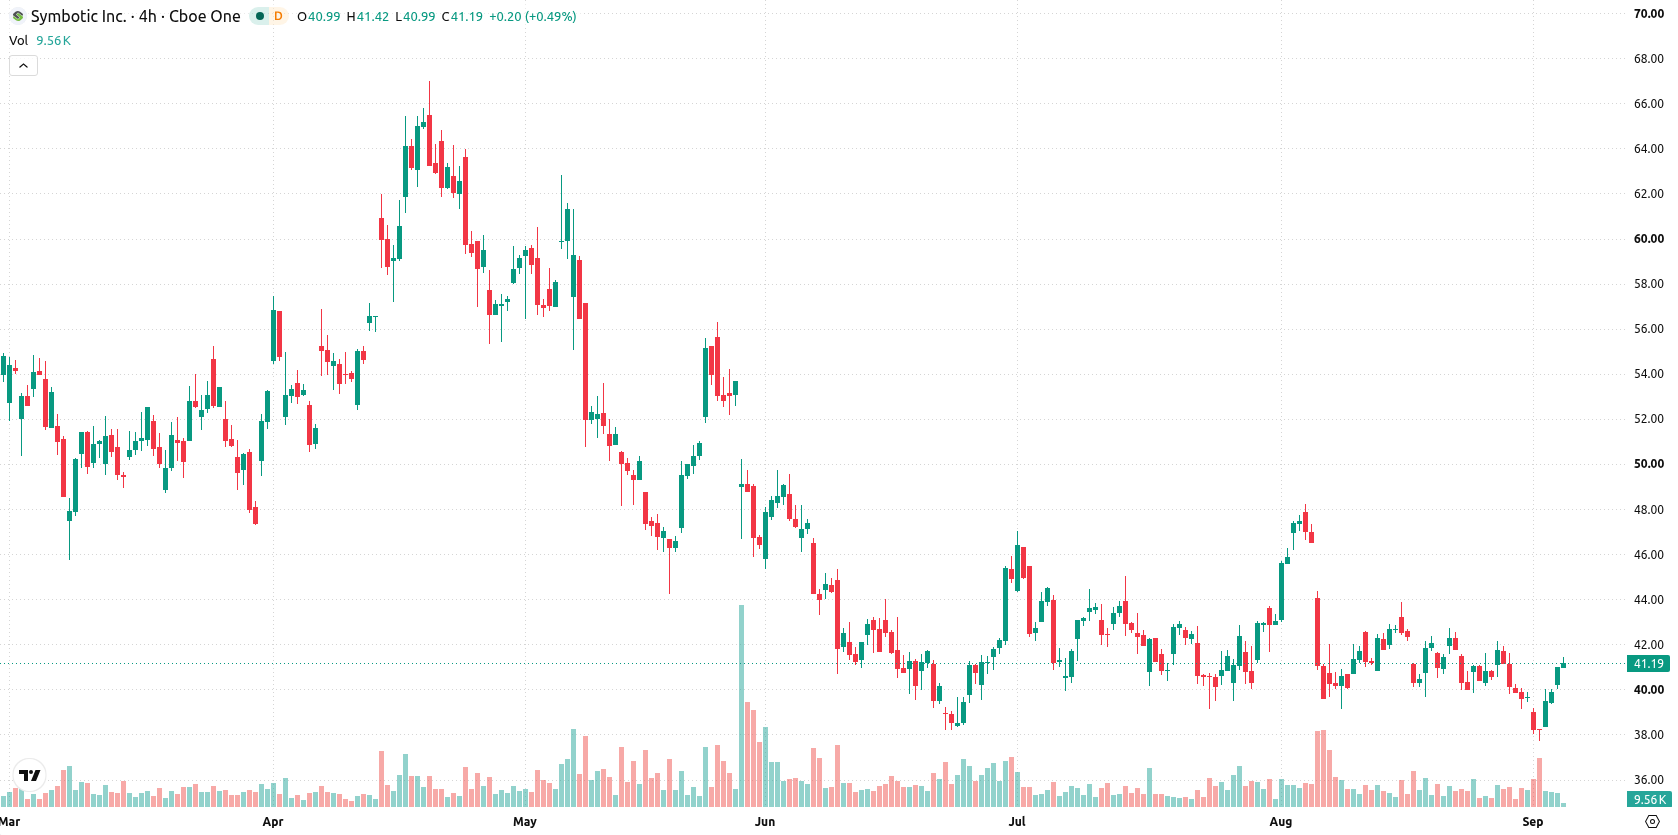
Mixed intraday strength as technical barriers and momentum signals diverge
Symbotic is trading above the 20-day moving average at $40.77, though it remains below the 50-day at $41.89 and the 200-day at $52.68. This structure suggests sustained short-term momentum but continued seller pressure at higher timeframes, with immediate resistance at $41.58 and support at $40.83. The MA-50 versus MA-200 alignment confirms a bearish long-term trend. Momentum signals are mixed: the MACD and RSI both forecast selling pressure, with the RSI at 45.46 indicating a slightly bearish setup, while the CCI and Bull/Bear Power (BBP) are oversold and BBP at -0.36 signals sellers dominate intraday. Stochastic RSI and Hull Moving Average both tilt strongly bullish, contrasting with the negative momentum bias from most other indicators. The average directional index (ADX) remains neutral. Intraday, Symbotic has moved up $1.39, or 3.49%, opening higher by 1.08% and trading close to its daily high, with observed volatility at 2.07%. The intraday tone is strong toward the highs, even as broader momentum signals remain divided.
Previously it was reported that Symbotic's technical outlook was constrained by persistent bearish momentum and ongoing downside risk despite efforts at customer diversification. The current analysis adds a short-term bullish dimension while confirming that sustained resistance in the medium and long term makes the $41.58 level critical for any potential upside breakout.






Latest Symbotic News



-
 Afghanistan
-
 Albania
-
 Algeria
-
 Angola
-
 Argentina
-
 Armenia
-
 Australia
-
 Austria
-
 Azerbaijan
-
 Bahamas
-
 Bahrain
-
 Bangladesh
-
 Belarus
-
 Belgium
-
 Bolivia
-
 Botswana
-
 Brazil
-
 Brunei
-
 Bulgaria
-
 Cambodia
-
 Cameroon
-
 Canada
-
 Chile
-
 China
-
 Colombia
-
 Congo
-
 Costa Rica
-
 Cote d'Ivoire
-
 Croatia
-
 Cuba
-
 Cyprus
-
 Czechia
-
 DR Congo
-
 Denmark
-
 Dominican Republic
-
 Ecuador
-
 Egypt
-
 El Salvador
-
 Estonia
-
 Eswatini
-
 Ethiopia
-
 Finland
-
 France
-
 Georgia
-
 Germany
-
 Ghana
-
 Greece
-
 Haiti
-
 Hong Kong
-
 Hungary
-
 India
-
 Indonesia
-
 Iran, Islamic republic
-
 Iraq
-
 Ireland
-
 Israel
-
 Italy
-
 Jamaica
-
 Japan
-
 Jordan
-
 Kazakhstan
-
 Kenya
-
 Korea
-
 Kuwait
-
 Kyrgyzstan
-
 Laos
-
 Latvia
-
 Lebanon
-
 Lesotho
-
 Libya
-
 Lithuania
-
 Luxembourg
-
 Madagascar
-
 Malaysia
-
 Malta
-
 Mauritius
-
 Mexico
-
 Moldova
-
 Mongolia
-
 Montenegro
-
 Morocco
-
 Mozambique
-
 Myanmar
-
 Namibia
-
 Nepal
-
 Netherlands
-
 New Zealand
-
 Nigeria
-
 North Macedonia
-
 Norway
-
 Oman
-
 Pakistan
-
 Palestine
-
 Panama
-
 Papua New Guinea
-
 Paraguay
-
 Peru
-
 Philippines
-
 Poland
-
 Portugal
-
 Puerto Rico
-
 Qatar
-
 Reunion
-
 Romania
-
 Rwanda
-
 Saudi Arabia
-
 Serbia
-
 Singapore
-
 Slovakia
-
 Slovenia
-
 Somalia
-
 South Africa
-
 Spain
-
 Sri Lanka
-
 Sweden
-
 Switzerland
-
 Syria
-
 Taiwan
-
 Tajikistan
-
 Tanzania
-
 Thailand
-
 Trinidad and Tobago
-
 Tunisia
-
 Turkey
-
 UAE
-
 Uganda
-
 Ukraine
-
 United Kingdom
-
United States
-
 Uruguay
-
 Uzbekistan
-
 Venezuela
-
 Vietnam
-
 Yemen
-
 Zambia
-
 Zimbabwe
- Forex
- Crypto












