

What's behind Symbotic's latest 3.1% stock surge?

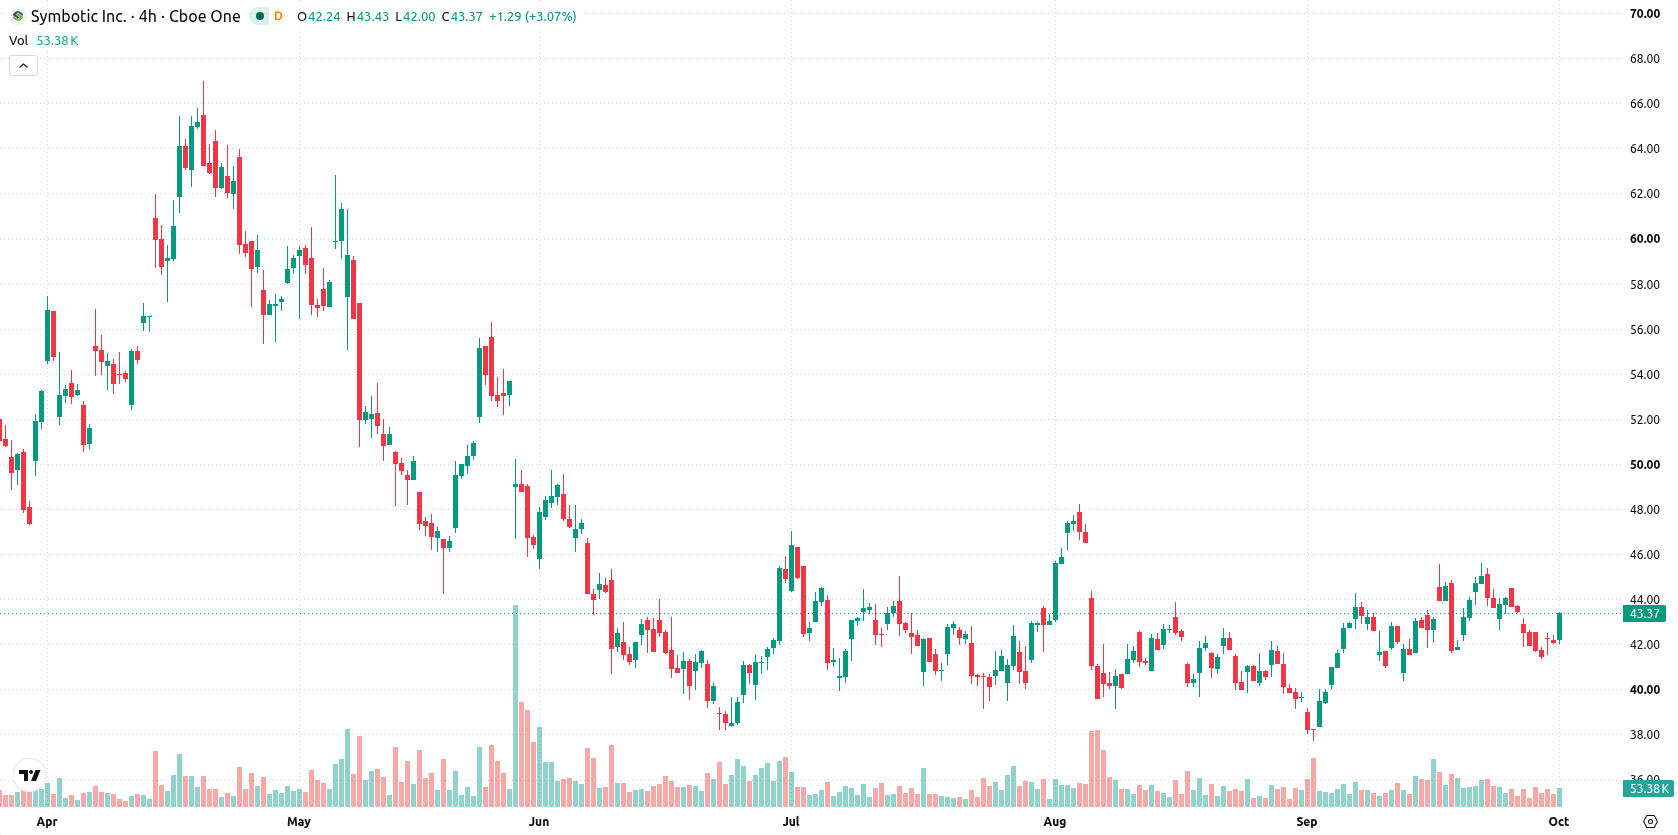
Symbotic Inc (SYM) climbed 3.13% as investors focused on upcoming earnings and robust revenue growth expectations. The move is supported in the short and medium term by its position above key moving averages, though gains remain capped by a longer-term bearish structure.
 34.74
36.08
Highlights
- Symbotic stock faces an upcoming quarterly report with analysts projecting earnings per share of $0.16 and nearly 25% annual revenue growth.
- The company recently achieved profitability, maintains a substantial warehouse automation backlog, and has completed almost 20,000 bots as of mid-2025.
- Shares trade in a 41.79 to 44.98 range, with short-term bullish technicals but a longer-term bearish tilt and mixed momentum indicators.
Profitability milestones and backlog strength bolster analyst optimism
Symbotic is set to release its next financial results, with analysts forecasting an earnings per share of $0.16 and revenue rising nearly 25% year-over-year. The company maintains a significant backlog in warehouse automation and has recently achieved profitability, aided by a manufacturing partnership with Jabil. Executives also confirmed production milestones, with 10,000 bots completed as of June 2025 and the total nearing 20,000.
Mixed momentum as stock nears resistance within conflicting signals
Symbotic is trading above its 20-day moving average (MA-20) at $42.68 and 50-day moving average (MA-50) at $42.05, but remains below the 200-day moving average (MA-200) at $50.61. This alignment favors a short- and medium-term bullish tone, but reinforces a bearish bias in the longer-term trend due to the MA-50 vs MA-200 positioning. The stock is currently trading near its near-term floor at $43.23, with the next major resistance at the near-term ceiling of $44.49. Momentum signals show mixed conditions: the Moving Average Convergence Divergence (MACD) indicates strong buy momentum, whereas the Average Directional Index (ADX) remains neutral at low levels. Overbought/oversold metrics are conflicted, with the Relative Strength Index (RSI) at 48.56 and in sell mode, Commodity Channel Index (CCI) neutral, and Stochastic RSI deeply oversold. Bull/Bear Power (BBP) stands at -0.17, signaling sellers dominate intraday momentum and forecasting an oversold environment. The stock is up $1.32 or 3.13% with an upside gap of $0.11 (0.26%). It is trading near the session high and daily volatility amplitude is 2.93%. The intraday tone leans stronger into resistance, but momentum signals are not aligned.
Earlier, analysts noted that Symbotic faced persistent technical resistance despite occasional bullish momentum, with management's insider activity drawing further attention to the stock's trend constraints. The present analysis adds fresh insight by highlighting a tighter trading band and heightened downside probability, making the $43.23 support and $44.49 resistance critical levels to monitor in the days ahead.










-
 Afghanistan
-
 Albania
-
 Algeria
-
 Angola
-
 Argentina
-
 Armenia
-
 Australia
-
 Austria
-
 Azerbaijan
-
 Bahamas
-
 Bahrain
-
 Bangladesh
-
 Belarus
-
 Belgium
-
 Bolivia
-
 Botswana
-
 Brazil
-
 Brunei
-
 Bulgaria
-
 Cambodia
-
 Cameroon
-
 Canada
-
 Chile
-
 China
-
 Colombia
-
 Congo
-
 Costa Rica
-
 Cote d'Ivoire
-
 Croatia
-
 Cuba
-
 Cyprus
-
 Czechia
-
 DR Congo
-
 Denmark
-
 Dominican Republic
-
 Ecuador
-
 Egypt
-
 El Salvador
-
 Estonia
-
 Eswatini
-
 Ethiopia
-
 Finland
-
 France
-
 Georgia
-
 Germany
-
 Ghana
-
 Greece
-
 Haiti
-
 Hong Kong
-
 Hungary
-
 India
-
 Indonesia
-
 Iran, Islamic republic
-
 Iraq
-
 Ireland
-
 Israel
-
 Italy
-
 Jamaica
-
 Japan
-
 Jordan
-
 Kazakhstan
-
 Kenya
-
 Korea
-
 Kuwait
-
 Kyrgyzstan
-
 Laos
-
 Latvia
-
 Lebanon
-
 Lesotho
-
 Libya
-
 Lithuania
-
 Luxembourg
-
 Madagascar
-
 Malaysia
-
 Malta
-
 Mauritius
-
 Mexico
-
 Moldova
-
 Mongolia
-
 Montenegro
-
 Morocco
-
 Mozambique
-
 Myanmar
-
 Namibia
-
 Nepal
-
 Netherlands
-
 New Zealand
-
 Nigeria
-
 North Macedonia
-
 Norway
-
 Oman
-
 Pakistan
-
 Palestine
-
 Panama
-
 Papua New Guinea
-
 Paraguay
-
 Peru
-
 Philippines
-
 Poland
-
 Portugal
-
 Puerto Rico
-
 Qatar
-
 Reunion
-
 Romania
-
 Rwanda
-
 Saudi Arabia
-
 Serbia
-
 Singapore
-
 Slovakia
-
 Slovenia
-
 Somalia
-
 South Africa
-
 Spain
-
 Sri Lanka
-
 Sweden
-
 Switzerland
-
 Syria
-
 Taiwan
-
 Tajikistan
-
 Tanzania
-
 Thailand
-
 Trinidad and Tobago
-
 Tunisia
-
 Turkey
-
 UAE
-
 Uganda
-
 Ukraine
-
 United Kingdom
-
United States
-
 Uruguay
-
 Uzbekistan
-
 Venezuela
-
 Vietnam
-
 Yemen
-
 Zambia
-
 Zimbabwe
- Forex
- Crypto












