

Can workforce reduction in India pressure PayPal stock?

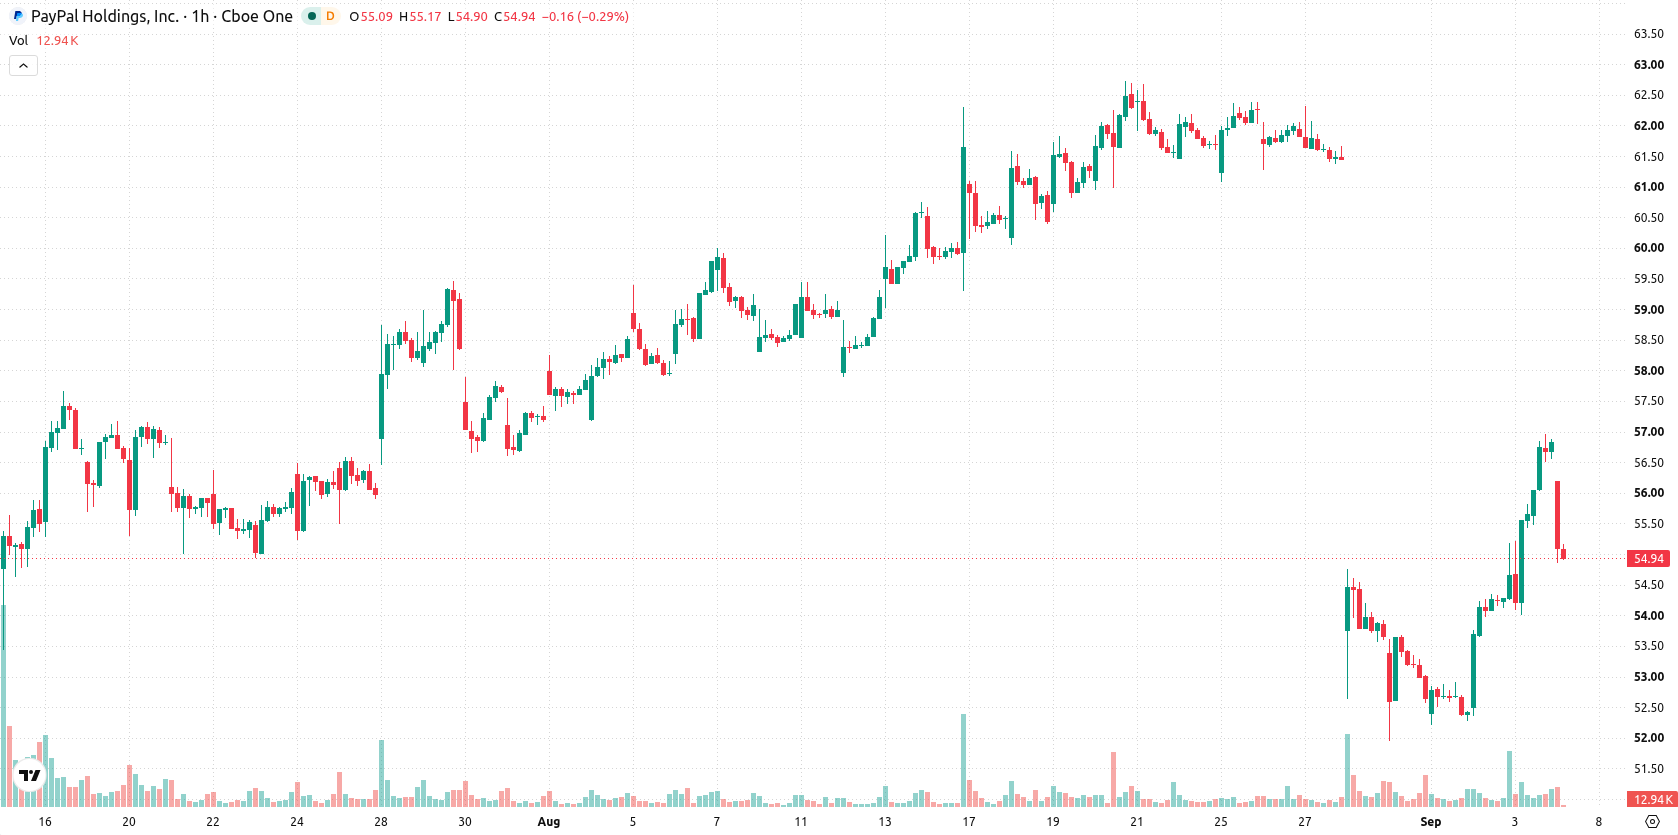
PayPal Holdings, Inc. (PYPL) stock is trading at $55.04 after closing down 3.13% on the day. The stock is currently positioned above its key short-term average while remaining below a primary medium-term average, and it continues to hold above a major long-term support benchmark.
 59.67
59.67
Highlights
- PayPal Holdings cut approximately 220 jobs in India, about 4% of its local workforce, to reduce global costs and restructure operations.
- Renewed speculation about a potential takeover of PayPal has increased event-driven interest, but the stock continues to face broad selling pressure.
- Shares of PayPal trade with mixed momentum and overbought signals, likely consolidating between $52.95 and $57.81 in the next 2 to 3 days.
Global job cuts and takeover speculation intensify event-driven sentiment
PayPal Holdings eliminated approximately 220 positions in India, accounting for about 4% of its local workforce, as part of a global cost-reduction and restructuring effort, according to Investing.com. This action directly lowers payroll expenses and reflects management's intent to streamline operations and address profitability challenges. In addition, renewed takeover speculation surrounding PayPal has surfaced in recent sessions, as reported by Finance Yahoo, contributing to heightened event-driven attention among investors, though price action has remained under broader selling pressure.
Mixed momentum as overbought signals challenge continued upside
On the technical front, PYPL sits above the MA-20 but below the MA-50 on the H1 timeframe, while maintaining a position above the MA-200 on the daily chart. The Ichimoku Kijun line at $54.62 offers immediate support for the stock. Short-term momentum indicators present a mixed picture: the RSI reads 68 (Buy) and ADX confirms a Buy signal, while MACD remains neutral. Meanwhile, Stochastic RSI, CCI, and Bull/Bear Power all highlight overbought conditions, indicating strong buyer pressure intraday. The Awesome Oscillator aligns with this upward momentum. Notably, overbought oscillator readings and divergence alongside bullish momentum suggest potential exhaustion is emerging even as volatility stays elevated.
Downside favored as volatility bands guide near-term outlook
Over the next 2–3 trading days, PYPL’s price action is expected to remain within the $52.95 to $57.81 volatility band relative to current levels. With the up probability at 26%, further downward movement is more likely. The baseline scenario sees price consolidating in this corridor. A bullish scenario would see price break resistance and move toward the upper range, while a bearish case may see support give way and the price testing the lower boundary.
Previously it was reported that analysts expected PayPal shares to remain range-bound amid ongoing restructuring efforts and persistent downside risks. The latest developments reinforce this cautious outlook, with short-term signals suggesting potential exhaustion and highlighting $54.62 as a key technical level to monitor for shifts in near-term price direction.










-
 Afghanistan
-
 Albania
-
 Algeria
-
 Angola
-
 Argentina
-
 Armenia
-
 Australia
-
 Austria
-
 Azerbaijan
-
 Bahamas
-
 Bahrain
-
 Bangladesh
-
 Belarus
-
 Belgium
-
 Bolivia
-
 Botswana
-
 Brazil
-
 Brunei
-
 Bulgaria
-
 Cambodia
-
 Cameroon
-
 Canada
-
 Chile
-
 China
-
 Colombia
-
 Congo
-
 Costa Rica
-
 Cote d'Ivoire
-
 Croatia
-
 Cuba
-
 Cyprus
-
 Czechia
-
 DR Congo
-
 Denmark
-
 Dominican Republic
-
 Ecuador
-
 Egypt
-
 El Salvador
-
 Estonia
-
 Eswatini
-
 Ethiopia
-
 Finland
-
 France
-
 Georgia
-
 Germany
-
 Ghana
-
 Greece
-
 Haiti
-
 Hong Kong
-
 Hungary
-
 India
-
 Indonesia
-
 Iran, Islamic republic
-
 Iraq
-
 Ireland
-
 Israel
-
 Italy
-
 Jamaica
-
 Japan
-
 Jordan
-
 Kazakhstan
-
 Kenya
-
 Korea
-
 Kuwait
-
 Kyrgyzstan
-
 Laos
-
 Latvia
-
 Lebanon
-
 Lesotho
-
 Libya
-
 Lithuania
-
 Luxembourg
-
 Madagascar
-
 Malaysia
-
 Malta
-
 Mauritius
-
 Mexico
-
 Moldova
-
 Mongolia
-
 Montenegro
-
 Morocco
-
 Mozambique
-
 Myanmar
-
 Namibia
-
 Nepal
-
 Netherlands
-
 New Zealand
-
 Nigeria
-
 North Macedonia
-
 Norway
-
 Oman
-
 Pakistan
-
 Palestine
-
 Panama
-
 Papua New Guinea
-
 Paraguay
-
 Peru
-
 Philippines
-
 Poland
-
 Portugal
-
 Puerto Rico
-
 Qatar
-
 Reunion
-
 Romania
-
 Rwanda
-
 Saudi Arabia
-
 Serbia
-
 Singapore
-
 Slovakia
-
 Slovenia
-
 Somalia
-
 South Africa
-
 Spain
-
 Sri Lanka
-
 Sweden
-
 Switzerland
-
 Syria
-
 Taiwan
-
 Tajikistan
-
 Tanzania
-
 Thailand
-
 Trinidad and Tobago
-
 Tunisia
-
 Turkey
-
 UAE
-
 Uganda
-
 Ukraine
-
 United Kingdom
-
United States
-
 Uruguay
-
 Uzbekistan
-
 Venezuela
-
 Vietnam
-
 Yemen
-
 Zambia
-
 Zimbabwe
- Forex
- Crypto












