

Workday stock falls nearly 4% as technical overextension and intraday volatility drive pullback

Workday Inc (WDAY) dropped 3.88% as technical overextension and intraday volatility triggered a pullback from recent highs. The decline is limited by the stock's ongoing position above the key 20-, 50-, and 200-day moving averages, which continue to confirm underlying bullish trends.
 196.66
Highlights
- Workday stock remains in a bullish trend, trading above all key short- and long-term moving averages.
- Momentum indicators are strong, with the MACD and ADX both confirming bullish direction while overbought signals persist.
- Shares recently closed at $198.97 after a 3.88% drop, with the expected five-day range at $191.32 to $211.91 and resistance at $203.98.
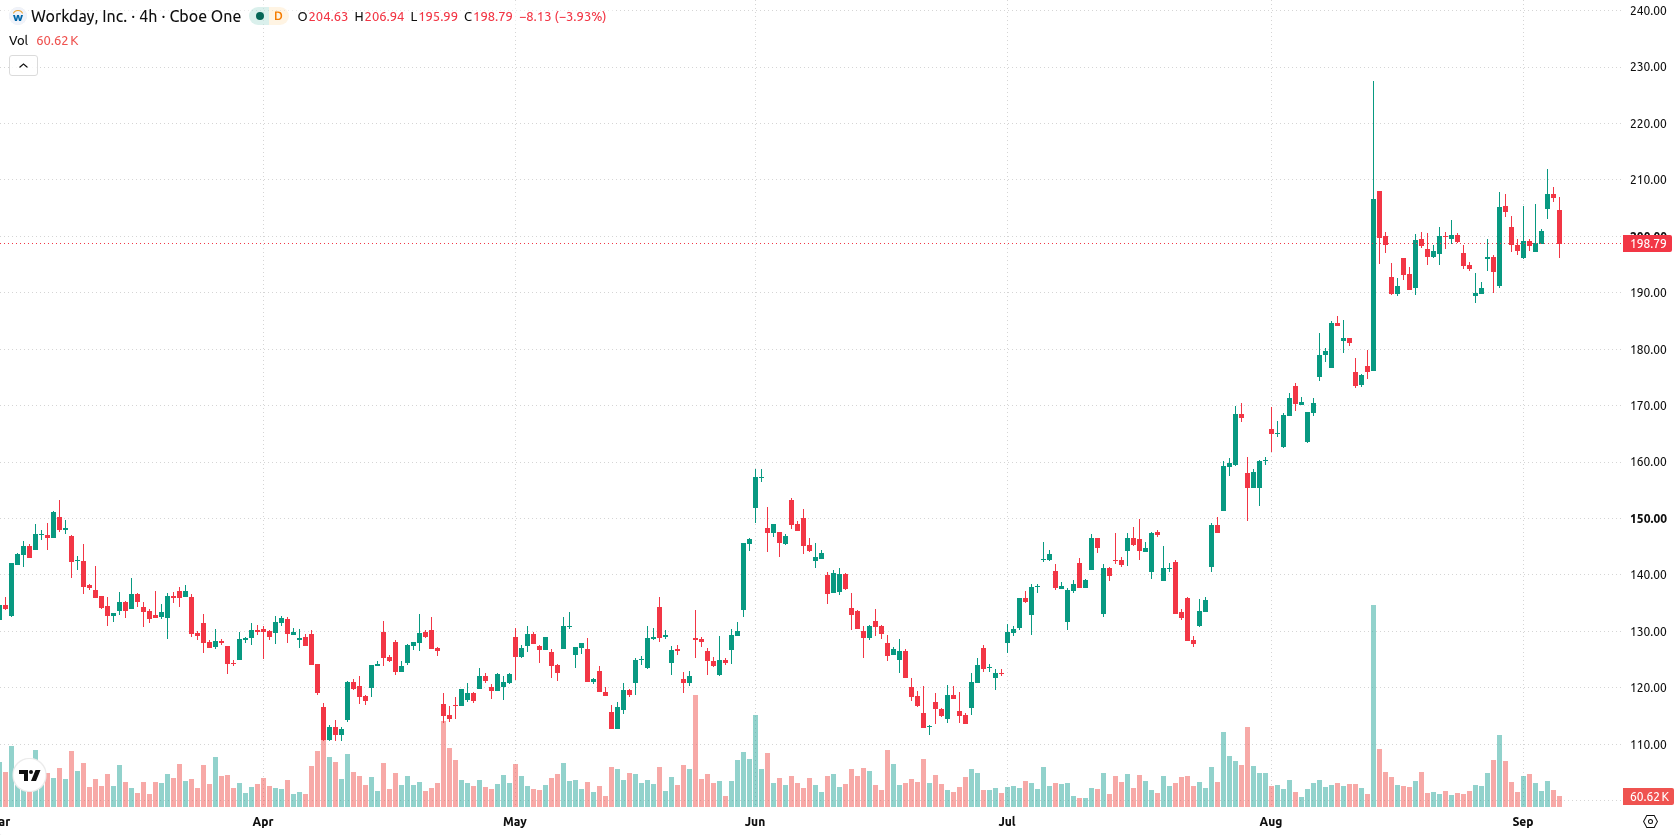
Bullish momentum sustained despite overbought technical signals
Workday is trading above the 20-day ($194.49), 50-day ($164.16), and 200-day ($160.33) moving averages, confirming short- and long-term bullish trends. The nearest resistance is at $203.98 and immediate support is at $196.45, with the Ichimoku Kijun at $188.52 providing additional trend confirmation. Momentum indicators are positive, with the MACD signaling a strong buy and the ADX affirming bullish strength. However, the RSI is elevated and in buy territory, while the Stochastic RSI, CCI, and BBP warn of overbought conditions. BBP indicates buyers dominate intraday momentum, and the Awesome Oscillator remains positive. Price is currently holding between $196.22 and $203.98, with intraday volatility at 3.95%. There has been pressure since the open, as strong momentum persists despite overbought warnings.
Earlier, analysts noted that Workday maintained a broadly bullish technical structure despite caution around overbought conditions. The current analysis reinforces this view, highlighting ongoing bullish momentum with a high probability of an upward move, while a drop below the $191.32 level would signal increased downside risk.






Latest Workday News




-
 Afghanistan
-
 Albania
-
 Algeria
-
 Angola
-
 Argentina
-
 Armenia
-
 Australia
-
 Austria
-
 Azerbaijan
-
 Bahamas
-
 Bahrain
-
 Bangladesh
-
 Belarus
-
 Belgium
-
 Bolivia
-
 Botswana
-
 Brazil
-
 Brunei
-
 Bulgaria
-
 Cambodia
-
 Cameroon
-
 Canada
-
 Chile
-
 China
-
 Colombia
-
 Congo
-
 Costa Rica
-
 Cote d'Ivoire
-
 Croatia
-
 Cuba
-
 Cyprus
-
 Czechia
-
 DR Congo
-
 Denmark
-
 Dominican Republic
-
 Ecuador
-
 Egypt
-
 El Salvador
-
 Estonia
-
 Eswatini
-
 Ethiopia
-
 Finland
-
 France
-
 Georgia
-
 Germany
-
 Ghana
-
 Greece
-
 Haiti
-
 Hong Kong
-
 Hungary
-
 India
-
 Indonesia
-
 Iran, Islamic republic
-
 Iraq
-
 Ireland
-
 Israel
-
 Italy
-
 Jamaica
-
 Japan
-
 Jordan
-
 Kazakhstan
-
 Kenya
-
 Korea
-
 Kuwait
-
 Kyrgyzstan
-
 Laos
-
 Latvia
-
 Lebanon
-
 Lesotho
-
 Libya
-
 Lithuania
-
 Luxembourg
-
 Madagascar
-
 Malaysia
-
 Malta
-
 Mauritius
-
 Mexico
-
 Moldova
-
 Mongolia
-
 Montenegro
-
 Morocco
-
 Mozambique
-
 Myanmar
-
 Namibia
-
 Nepal
-
 Netherlands
-
 New Zealand
-
 Nigeria
-
 North Macedonia
-
 Norway
-
 Oman
-
 Pakistan
-
 Palestine
-
 Panama
-
 Papua New Guinea
-
 Paraguay
-
 Peru
-
 Philippines
-
 Poland
-
 Portugal
-
 Puerto Rico
-
 Qatar
-
 Reunion
-
 Romania
-
 Rwanda
-
 Saudi Arabia
-
 Serbia
-
 Singapore
-
 Slovakia
-
 Slovenia
-
 Somalia
-
 South Africa
-
 Spain
-
 Sri Lanka
-
 Sweden
-
 Switzerland
-
 Syria
-
 Taiwan
-
 Tajikistan
-
 Tanzania
-
 Thailand
-
 Trinidad and Tobago
-
 Tunisia
-
 Turkey
-
 UAE
-
 Uganda
-
 Ukraine
-
 United Kingdom
-
United States
-
 Uruguay
-
 Uzbekistan
-
 Venezuela
-
 Vietnam
-
 Yemen
-
 Zambia
-
 Zimbabwe
- Forex
- Crypto












