

NFLX falls as short-term downtrend remains in effect

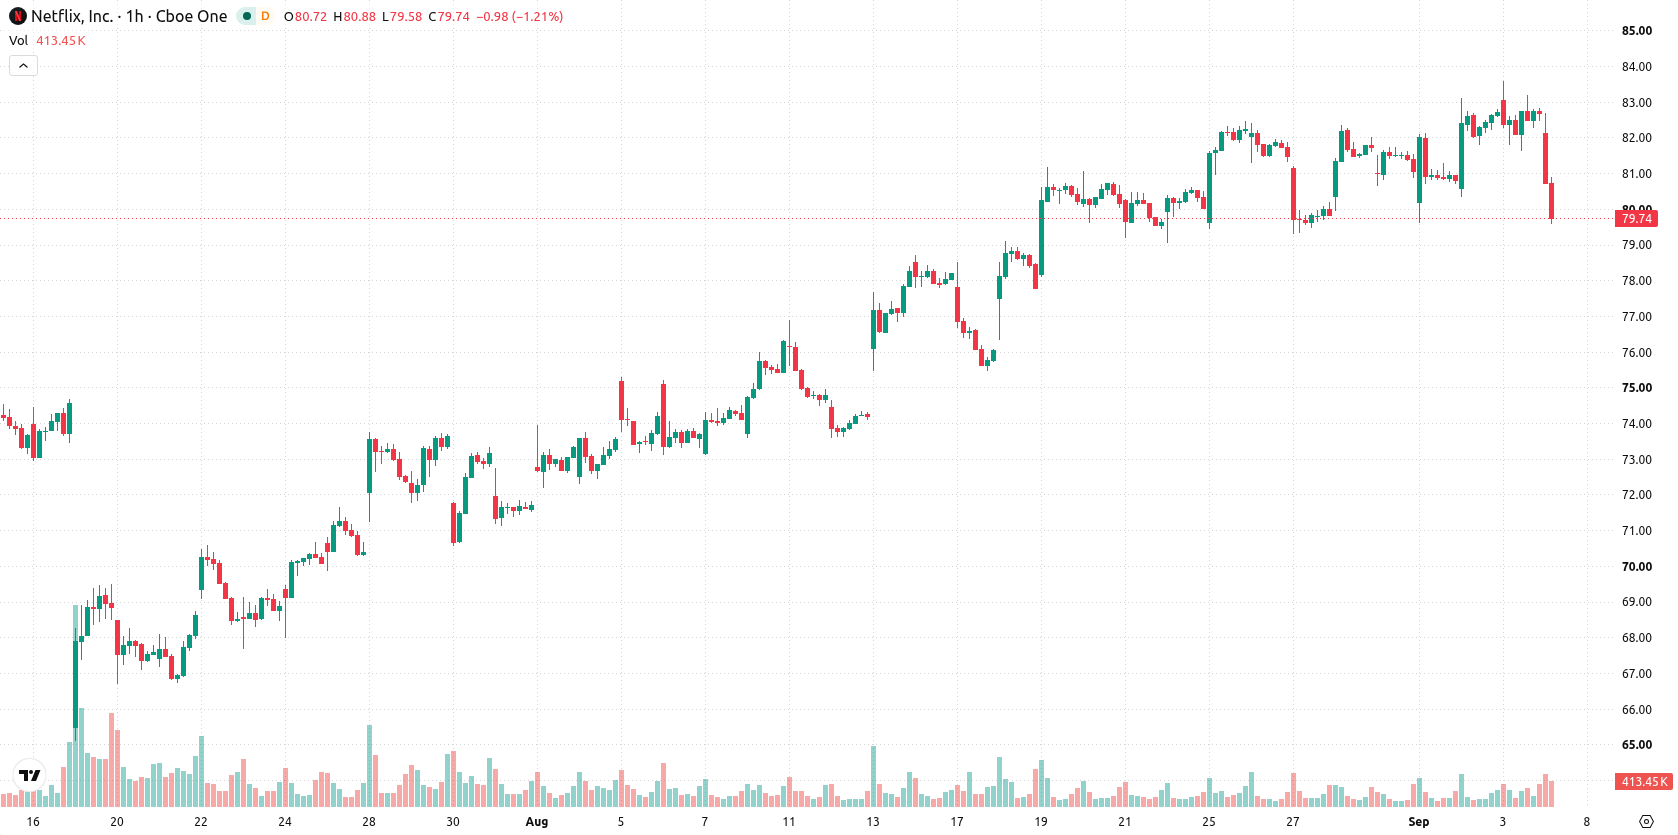
Netflix Inc. (NFLX) stock is trading at $79.89, marking a decline of 3.33% on the day. The price sits below its key moving averages, reflecting a continuation of short-term downward momentum.
 63.95
64.55
Highlights
- Nykredit A S acquired 1,732,435 shares of Netflix for $123,696,000 in the second quarter, indicating strong institutional demand.
- This significant investment may support Netflix stock liquidity over the long term, though recent trading has seen continued selling pressure.
- Netflix stock trades below key moving averages with short-term and long-term bearish trends, expected to consolidate between $78.79 and $83.41.
Institutional demand rises as Nykredit acquires significant stake
Nykredit A S acquired 1,732,435 shares of Netflix, Inc. in the second quarter, with a total investment valued at approximately $123,696,000, according to Themarketsdaily. This sizeable purchase represents a notable increase in institutional demand, which can enhance the available liquidity in the market. Such institutional activity may offer underlying support for the stock in the longer term, though price action has remained under broader selling pressure.
Bullish momentum indicators diverge as price faces key resistance
Technically, the price is positioned below the MA-20 at $82 and MA-50 at $81.52 on the hourly chart, as well as the MA-200 at $87.04 on the daily timeframe. The Ichimoku Kijun at $81.6 acts as the nearest overhead resistance. Among momentum indicators, MACD currently signals a buy, ADX is neutral, while both RSI and CCI are also in buy territory. Stoch RSI returns a sell signal, underscoring a divergence across oscillators. Bull/Bear Power reflects intraday bullish control, whereas the Awesome Oscillator remains neutral.
Mild downside bias as consolidation seen within volatility band
In the short term, NFLX is expected to consolidate within a typical volatility band between $78.79 and $83.41 over the next 2 to 3 trading days. The probability of an upward move is assessed at 48%, while the likelihood of a further decline is marginally higher at 52%. A break above $81.6 could trigger a bullish scenario, whereas failure of support near $78.79 may reinforce downside pressure.
Earlier, analysts noted that streaming-related trends and media innovations continue to shape both consumer behavior and the broader equity landscape. With institutional accumulation now visible alongside mixed technical signals, traders should closely watch the $81.6 resistance for any early signs of a sustained reversal.






Latest Netflix News




-
 Afghanistan
-
 Albania
-
 Algeria
-
 Angola
-
 Argentina
-
 Armenia
-
 Australia
-
 Austria
-
 Azerbaijan
-
 Bahamas
-
 Bahrain
-
 Bangladesh
-
 Belarus
-
 Belgium
-
 Bolivia
-
 Botswana
-
 Brazil
-
 Brunei
-
 Bulgaria
-
 Cambodia
-
 Cameroon
-
 Canada
-
 Chile
-
 China
-
 Colombia
-
 Congo
-
 Costa Rica
-
 Cote d'Ivoire
-
 Croatia
-
 Cuba
-
 Cyprus
-
 Czechia
-
 DR Congo
-
 Denmark
-
 Dominican Republic
-
 Ecuador
-
 Egypt
-
 El Salvador
-
 Estonia
-
 Eswatini
-
 Ethiopia
-
 Finland
-
 France
-
 Georgia
-
 Germany
-
 Ghana
-
 Greece
-
 Haiti
-
 Hong Kong
-
 Hungary
-
 India
-
 Indonesia
-
 Iran, Islamic republic
-
 Iraq
-
 Ireland
-
 Israel
-
 Italy
-
 Jamaica
-
 Japan
-
 Jordan
-
 Kazakhstan
-
 Kenya
-
 Korea
-
 Kuwait
-
 Kyrgyzstan
-
 Laos
-
 Latvia
-
 Lebanon
-
 Lesotho
-
 Libya
-
 Lithuania
-
 Luxembourg
-
 Madagascar
-
 Malaysia
-
 Malta
-
 Mauritius
-
 Mexico
-
 Moldova
-
 Mongolia
-
 Montenegro
-
 Morocco
-
 Mozambique
-
 Myanmar
-
 Namibia
-
 Nepal
-
 Netherlands
-
 New Zealand
-
 Nigeria
-
 North Macedonia
-
 Norway
-
 Oman
-
 Pakistan
-
 Palestine
-
 Panama
-
 Papua New Guinea
-
 Paraguay
-
 Peru
-
 Philippines
-
 Poland
-
 Portugal
-
 Puerto Rico
-
 Qatar
-
 Reunion
-
 Romania
-
 Rwanda
-
 Saudi Arabia
-
 Serbia
-
 Singapore
-
 Slovakia
-
 Slovenia
-
 Somalia
-
 South Africa
-
 Spain
-
 Sri Lanka
-
 Sweden
-
 Switzerland
-
 Syria
-
 Taiwan
-
 Tajikistan
-
 Tanzania
-
 Thailand
-
 Trinidad and Tobago
-
 Tunisia
-
 Turkey
-
 UAE
-
 Uganda
-
 Ukraine
-
 United Kingdom
-
United States
-
 Uruguay
-
 Uzbekistan
-
 Venezuela
-
 Vietnam
-
 Yemen
-
 Zambia
-
 Zimbabwe
- Forex
- Crypto












