

What's behind Tyler Technologies's latest 3.2% stock pullback?

A burst of selling pressure drove Tyler Technologies, Inc. (TYL) down 3.17% as short-term momentum signaled a divergence from the prevailing technical strength. The drop contradicts the bullish momentum backdrop, with the stock still holding above its key 20-, 50-, and 200-day moving averages.
 397.23
389.05
Highlights
- Shares of Tyler Technologies fell 3.17% to $367.26 with intraday volatility at 3.9%.
- Technical signals indicate strong upward momentum and overbought conditions, with buyer dominance prevailing intraday.
- Expected price range for the next five days is $354.85 to $379.67, with over 80% probability of an upward rebound.
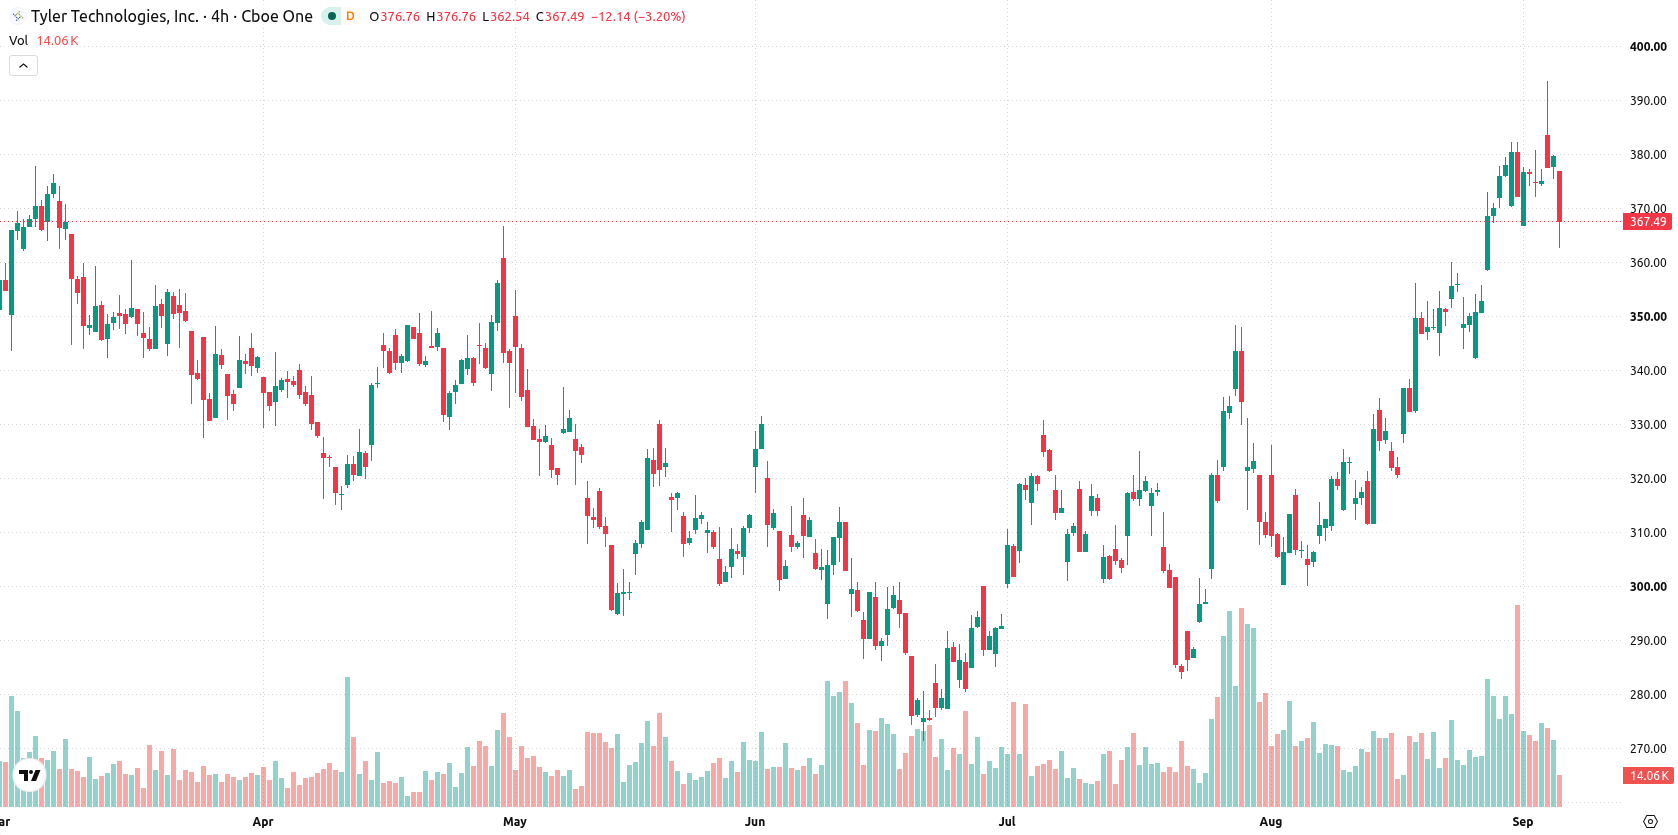
Sustained bullish alignment as technical signals counter early selloff
Tyler Technologies is trading above the 20-day ($346.84), 50-day ($323.6), and 200-day ($358.07) moving averages, indicating strength across short-, medium-, and long-term trends. The near-term ceiling is at $368.71 and the floor is at $360.54, with a longer-term bearish alignment still persisting. Momentum remains strong, with both the MACD and ADX signaling buy conditions. The RSI stands at 70.22, while Stochastic RSI, CCI, and BBP all highlight overbought conditions, confirming buyer dominance intraday. The Awesome Oscillator also supports the upward trend. Intraday, the stock experienced a downside gap and sits mid-range for the session with volatility at 3.90%. Sellers applied pressure early, but momentum indicators stay bullish, showing a divergence between the short-term selloff and underlying positive momentum.
Earlier, analysts noted that Tyler Technologies was demonstrating sustained bullish momentum, reinforced by recent institutional accumulation, but cautioned that technical resistance and a bearish longer-term trend could limit its advance. The current divergence between short-term selling pressure and underlying bullish indicators adds complexity to the outlook, making the $360.54 support a critical level to monitor for a potential shift in direction.






Latest Tyler Technologies News




-
 Afghanistan
-
 Albania
-
 Algeria
-
 Angola
-
 Argentina
-
 Armenia
-
 Australia
-
 Austria
-
 Azerbaijan
-
 Bahamas
-
 Bahrain
-
 Bangladesh
-
 Belarus
-
 Belgium
-
 Bolivia
-
 Botswana
-
 Brazil
-
 Brunei
-
 Bulgaria
-
 Cambodia
-
 Cameroon
-
 Canada
-
 Chile
-
 China
-
 Colombia
-
 Congo
-
 Costa Rica
-
 Cote d'Ivoire
-
 Croatia
-
 Cuba
-
 Cyprus
-
 Czechia
-
 DR Congo
-
 Denmark
-
 Dominican Republic
-
 Ecuador
-
 Egypt
-
 El Salvador
-
 Estonia
-
 Eswatini
-
 Ethiopia
-
 Finland
-
 France
-
 Georgia
-
 Germany
-
 Ghana
-
 Greece
-
 Haiti
-
 Hong Kong
-
 Hungary
-
 India
-
 Indonesia
-
 Iran, Islamic republic
-
 Iraq
-
 Ireland
-
 Israel
-
 Italy
-
 Jamaica
-
 Japan
-
 Jordan
-
 Kazakhstan
-
 Kenya
-
 Korea
-
 Kuwait
-
 Kyrgyzstan
-
 Laos
-
 Latvia
-
 Lebanon
-
 Lesotho
-
 Libya
-
 Lithuania
-
 Luxembourg
-
 Madagascar
-
 Malaysia
-
 Malta
-
 Mauritius
-
 Mexico
-
 Moldova
-
 Mongolia
-
 Montenegro
-
 Morocco
-
 Mozambique
-
 Myanmar
-
 Namibia
-
 Nepal
-
 Netherlands
-
 New Zealand
-
 Nigeria
-
 North Macedonia
-
 Norway
-
 Oman
-
 Pakistan
-
 Palestine
-
 Panama
-
 Papua New Guinea
-
 Paraguay
-
 Peru
-
 Philippines
-
 Poland
-
 Portugal
-
 Puerto Rico
-
 Qatar
-
 Reunion
-
 Romania
-
 Rwanda
-
 Saudi Arabia
-
 Serbia
-
 Singapore
-
 Slovakia
-
 Slovenia
-
 Somalia
-
 South Africa
-
 Spain
-
 Sri Lanka
-
 Sweden
-
 Switzerland
-
 Syria
-
 Taiwan
-
 Tajikistan
-
 Tanzania
-
 Thailand
-
 Trinidad and Tobago
-
 Tunisia
-
 Turkey
-
 UAE
-
 Uganda
-
 Ukraine
-
 United Kingdom
-
United States
-
 Uruguay
-
 Uzbekistan
-
 Venezuela
-
 Vietnam
-
 Yemen
-
 Zambia
-
 Zimbabwe
- Forex
- Crypto












