

HIMS trades flat as FTC complaint over health data sharing weighs

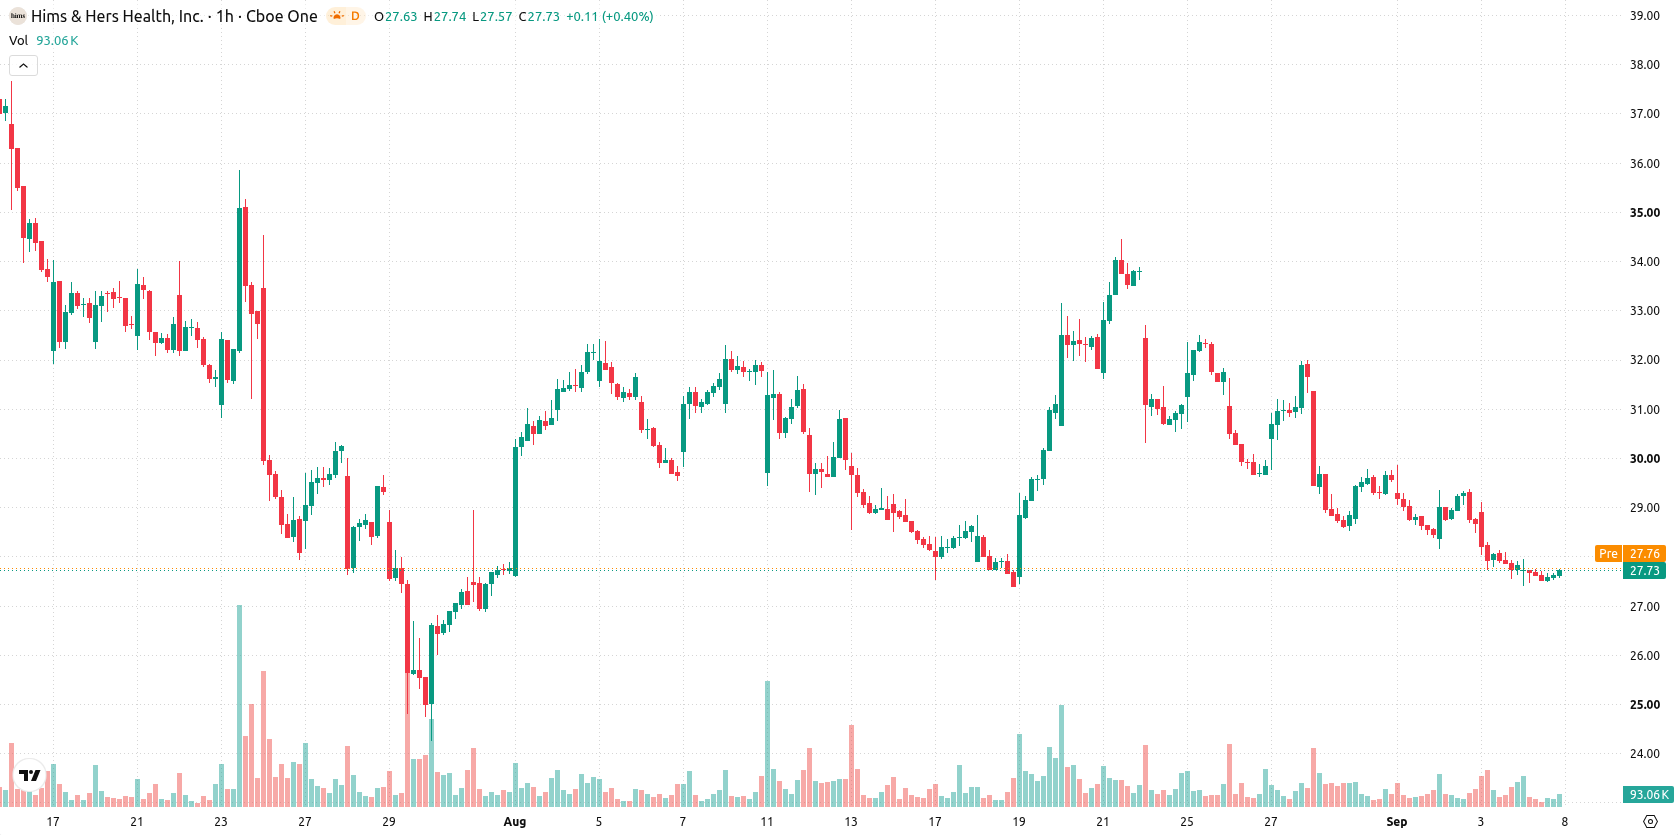
Hims & Hers Health Inc. (HIMS) stock is trading at $27.71, slipping modestly in the latest session. The price remains below its key moving averages, indicating persistent headwinds in the short to long-term outlook.
 26.23
28.61
Highlights
- Hims & Hers Health stock faces elevated legal risk as the company and executives are targeted by a securities class action lawsuit after alleged data privacy violations and questionable billing practices.
- Regulatory scrutiny rose with Federal Trade Commission allegations that the firm shared sensitive health data and used recurring billing models without proper consent, potentially breaching consumer protection laws.
- Shares of Hims & Hers Health trade below key moving averages with persistent selling pressure, projected to fluctuate in a $26.64 to $28.78 range and a 75% probability of further downside.
Legal and regulatory risks rise after FTC and lawsuit allegations
Hims & Hers Health, Inc. and certain executives are now subject to a securities class action lawsuit after the Federal Trade Commission filed a complaint accusing the company of sharing sensitive health information with third-party advertising platforms and billing for prescriptions prior to consultation, according to Prnewswire. The complaint also alleges the firm implemented recurring subscription models without informed consumer consent, potentially violating the Restore Online Shoppers' Confidence Act (ROSCA). These developments heighten regulatory scrutiny and add material legal risks, which may intensify investor caution regarding HIMS shares.
Momentum confusion as selling bias meets key resistance zone
On the technical front, HIMS is trading below both the MA-20 at $28.14 and MA-50 at $29.01 on the hourly chart, as well as below the MA-200 at $28.38 on the daily timeframe. The Ichimoku Kijun offers immediate resistance at $28.39, while support is established at $26.64. MACD continues to show a strong sell bias, while ADX is neutral. RSI and CCI both indicate selling pressure, but Stochastic RSI is in the overbought zone, pointing to intraday divergence among oscillators. Bull/Bear Power currently favors sellers, the Awesome Oscillator is neutral, and overall technicals reveal ongoing uncertainty with modest attempts at recovery.
Further downside risk as volatility bands limit breakout odds
Looking ahead, HIMS is expected to trade within a volatility band of $26.64 to $28.78 over the next several sessions. The base scenario anticipates sideways movement inside this range, as mixed technical signals provide little directional clarity. While a breakout above $28.39 could open a bullish scenario, a drop below $26.64 would signal a possible increase in downside momentum. Based on current trends, the probability of an upward breakout is 25%, with a 75% likelihood for a downward move.
Earlier, analysts noted that persistent technical weakness and legal uncertainties were maintaining downside pressure on Hims & Hers shares. The current article adds significant regulatory risk stemming from new FTC allegations, making the potential for a sustained move below support an important risk to monitor in the days ahead.






Latest Hims & Hers News





-
 Afghanistan
-
 Albania
-
 Algeria
-
 Angola
-
 Argentina
-
 Armenia
-
 Australia
-
 Austria
-
 Azerbaijan
-
 Bahamas
-
 Bahrain
-
 Bangladesh
-
 Belarus
-
 Belgium
-
 Bolivia
-
 Botswana
-
 Brazil
-
 Brunei
-
 Bulgaria
-
 Cambodia
-
 Cameroon
-
 Canada
-
 Chile
-
 China
-
 Colombia
-
 Congo
-
 Costa Rica
-
 Cote d'Ivoire
-
 Croatia
-
 Cuba
-
 Cyprus
-
 Czechia
-
 DR Congo
-
 Denmark
-
 Dominican Republic
-
 Ecuador
-
 Egypt
-
 El Salvador
-
 Estonia
-
 Eswatini
-
 Ethiopia
-
 Finland
-
 France
-
 Georgia
-
 Germany
-
 Ghana
-
 Greece
-
 Haiti
-
 Hong Kong
-
 Hungary
-
 India
-
 Indonesia
-
 Iran, Islamic republic
-
 Iraq
-
 Ireland
-
 Israel
-
 Italy
-
 Jamaica
-
 Japan
-
 Jordan
-
 Kazakhstan
-
 Kenya
-
 Korea
-
 Kuwait
-
 Kyrgyzstan
-
 Laos
-
 Latvia
-
 Lebanon
-
 Lesotho
-
 Libya
-
 Lithuania
-
 Luxembourg
-
 Madagascar
-
 Malaysia
-
 Malta
-
 Mauritius
-
 Mexico
-
 Moldova
-
 Mongolia
-
 Montenegro
-
 Morocco
-
 Mozambique
-
 Myanmar
-
 Namibia
-
 Nepal
-
 Netherlands
-
 New Zealand
-
 Nigeria
-
 North Macedonia
-
 Norway
-
 Oman
-
 Pakistan
-
 Palestine
-
 Panama
-
 Papua New Guinea
-
 Paraguay
-
 Peru
-
 Philippines
-
 Poland
-
 Portugal
-
 Puerto Rico
-
 Qatar
-
 Reunion
-
 Romania
-
 Rwanda
-
 Saudi Arabia
-
 Serbia
-
 Singapore
-
 Slovakia
-
 Slovenia
-
 Somalia
-
 South Africa
-
 Spain
-
 Sri Lanka
-
 Sweden
-
 Switzerland
-
 Syria
-
 Taiwan
-
 Tajikistan
-
 Tanzania
-
 Thailand
-
 Trinidad and Tobago
-
 Tunisia
-
 Turkey
-
 UAE
-
 Uganda
-
 Ukraine
-
 United Kingdom
-
United States
-
 Uruguay
-
 Uzbekistan
-
 Venezuela
-
 Vietnam
-
 Yemen
-
 Zambia
-
 Zimbabwe
- Forex
- Crypto












