

Will Reckitt Benckiser stock break GBX5,185 resistance as short-term uptrend stalls?

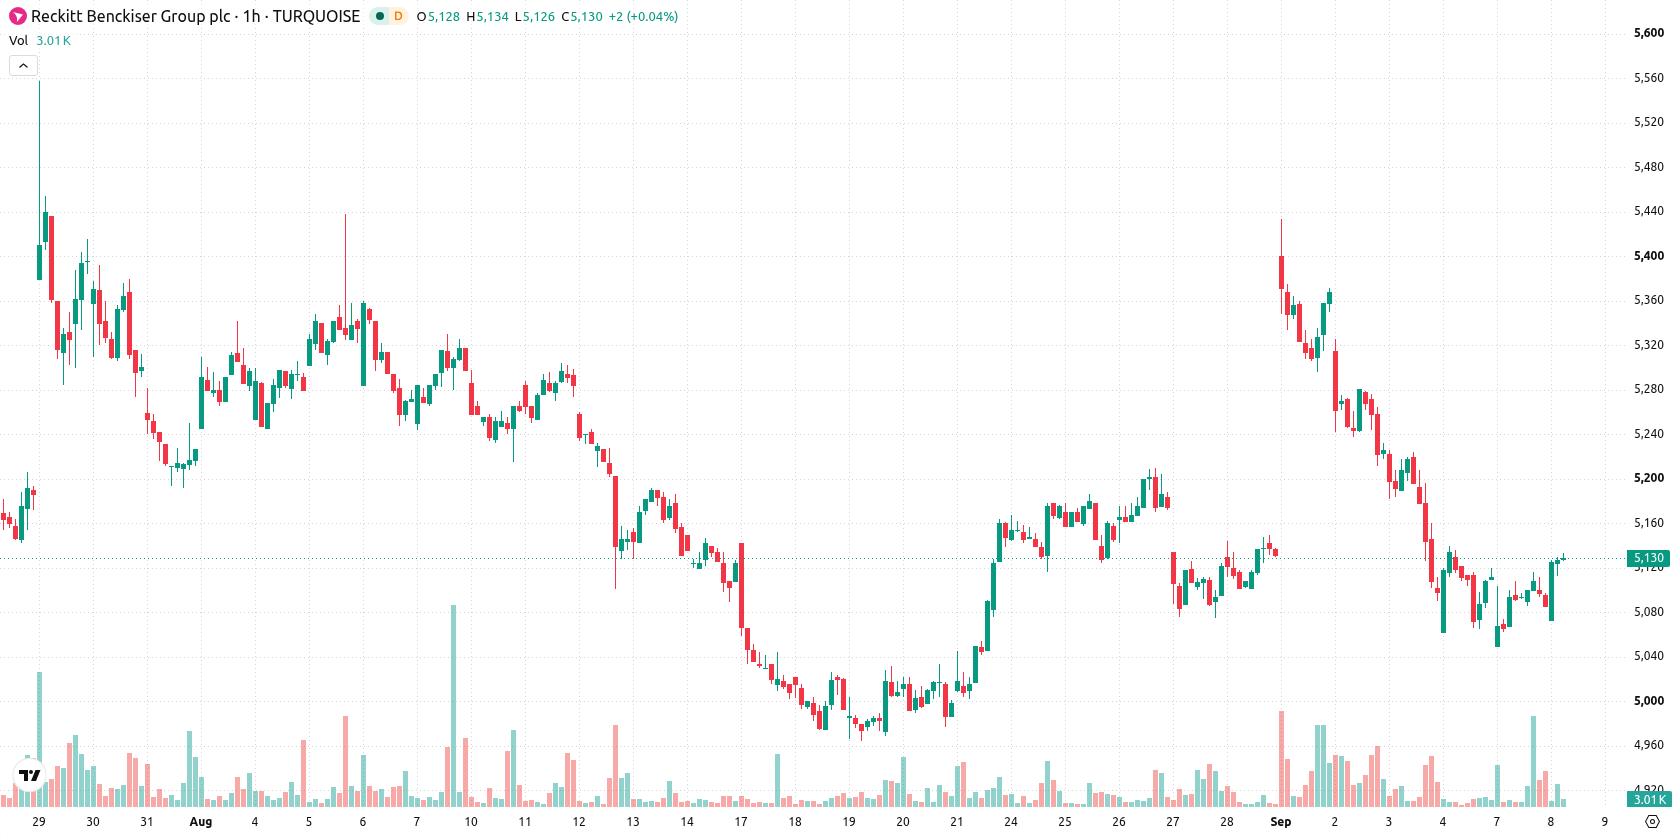
Reckitt Benckiser (RKT) stock is trading at GBX5,138, up 0.94% for the day and testing its session highs. The price sits above its short-term averages but remains beneath the longer-term trend levels.
 5716.00
5728.00
Highlights
- RKT/GBX trades above short-term support but remains below medium- and long-term moving averages, indicating a bearish broader trend.
- Momentum indicators show persistent seller pressure and weak directional commitment, with mixed overbought signals from oscillators.
- The expected price range for the next 2 to 3 days is GBX5,012 to GBX5,263, with a 60% probability of a downward move.
Mixed momentum as short-term support holds above key averages
Technically, RKT is trading above the MA-20 at GBX5,100, while staying below both the MA-50 at GBX5,185 and the MA-200 at GBX5,384. Near-term support is provided by the Ichimoku Kijun at GBX5,136. On the momentum side, MACD gives a Strong Sell signal, ADX is Neutral, and RSI stands at 47.33 (Sell). Stoch RSI and Bull/Bear Power both indicate overbought conditions, whereas CCI signals Buy, resulting in a mixed oscillator picture. Intraday, Bull/Bear Power shows continued buyer dominance, though the overall momentum context remains weak.
Price stabilization expected as upside faces resistance, downside risk persists
In the next 2–3 trading days, the expected price range is set between GBX5,012 and GBX5,263. There is a 60% probability of a downward move and a 40% chance of further upside from current levels. The baseline scenario is stabilization within this corridor; a push above resistance could attract new buyers, while a downside break would likely expose the lower end of the forecast range.
Earlier, analysts noted that Reckitt Benckiser’s technical outlook was predominantly bearish, with further downside anticipated amid continued pressure from sellers. The current analysis presents a more mixed technical picture, and with stabilizing short-term momentum, traders should monitor whether the stock can sustain a move above the 50-day average to signal a potential shift in trend.











-
 Afghanistan
-
 Albania
-
 Algeria
-
 Angola
-
 Argentina
-
 Armenia
-
 Australia
-
 Austria
-
 Azerbaijan
-
 Bahamas
-
 Bahrain
-
 Bangladesh
-
 Belarus
-
 Belgium
-
 Bolivia
-
 Botswana
-
 Brazil
-
 Brunei
-
 Bulgaria
-
 Cambodia
-
 Cameroon
-
 Canada
-
 Chile
-
 China
-
 Colombia
-
 Congo
-
 Costa Rica
-
 Cote d'Ivoire
-
 Croatia
-
 Cuba
-
 Cyprus
-
 Czechia
-
 DR Congo
-
 Denmark
-
 Dominican Republic
-
 Ecuador
-
 Egypt
-
 El Salvador
-
 Estonia
-
 Eswatini
-
 Ethiopia
-
 Finland
-
 France
-
 Georgia
-
 Germany
-
 Ghana
-
 Greece
-
 Haiti
-
 Hong Kong
-
 Hungary
-
 India
-
 Indonesia
-
 Iran, Islamic republic
-
 Iraq
-
 Ireland
-
 Israel
-
 Italy
-
 Jamaica
-
 Japan
-
 Jordan
-
 Kazakhstan
-
 Kenya
-
 Korea
-
 Kuwait
-
 Kyrgyzstan
-
 Laos
-
 Latvia
-
 Lebanon
-
 Lesotho
-
 Libya
-
 Lithuania
-
 Luxembourg
-
 Madagascar
-
 Malaysia
-
 Malta
-
 Mauritius
-
 Mexico
-
 Moldova
-
 Mongolia
-
 Montenegro
-
 Morocco
-
 Mozambique
-
 Myanmar
-
 Namibia
-
 Nepal
-
 Netherlands
-
 New Zealand
-
 Nigeria
-
 North Macedonia
-
 Norway
-
 Oman
-
 Pakistan
-
 Palestine
-
 Panama
-
 Papua New Guinea
-
 Paraguay
-
 Peru
-
 Philippines
-
 Poland
-
 Portugal
-
 Puerto Rico
-
 Qatar
-
 Reunion
-
 Romania
-
 Rwanda
-
 Saudi Arabia
-
 Serbia
-
 Singapore
-
 Slovakia
-
 Slovenia
-
 Somalia
-
 South Africa
-
 Spain
-
 Sri Lanka
-
 Sweden
-
 Switzerland
-
 Syria
-
 Taiwan
-
 Tajikistan
-
 Tanzania
-
 Thailand
-
 Trinidad and Tobago
-
 Tunisia
-
 Turkey
-
 UAE
-
 Uganda
-
 Ukraine
-
 United Kingdom
-
United States
-
 Uruguay
-
 Uzbekistan
-
 Venezuela
-
 Vietnam
-
 Yemen
-
 Zambia
-
 Zimbabwe
- Forex
- Crypto












