

Why is Microsoft stock down today? Outlook and Exchange Online outage, key support levels to watch

Microsoft (MSFT) stock is trading at $491.82, marking a daily decline of 1.54%. The price sits below its key short- and medium-term moving averages, while holding above the long-term average.
 538.19
559.07
Highlights
- Microsoft experienced a major outage on August 31, 2026, disrupting Outlook and Exchange Online with over 8,000 user reports combined.
- The operational disruption has raised concerns about the reliability of Microsoft’s enterprise cloud offerings and pressured investor sentiment.
- Shares of Microsoft closed at $491.82, down 1.54%, with technical signals indicating near-term downside and an expected price range of $482.14 to $501.5.
Enterprise confidence pressured as outage triggers widespread cloud disruption
Microsoft experienced a major outage affecting its Outlook and Exchange Online platforms on August 31, 2026, with user reports of disruption peaking at 6,015 for Outlook and 2,044 for Microsoft 365, according to Finance Yahoo. The significant interruption to core communication and cloud services has raised concerns about the reliability of Microsoft’s enterprise offerings and put pressure on investor sentiment. This operational disruption stands out as a notable headwind in the current trading environment.
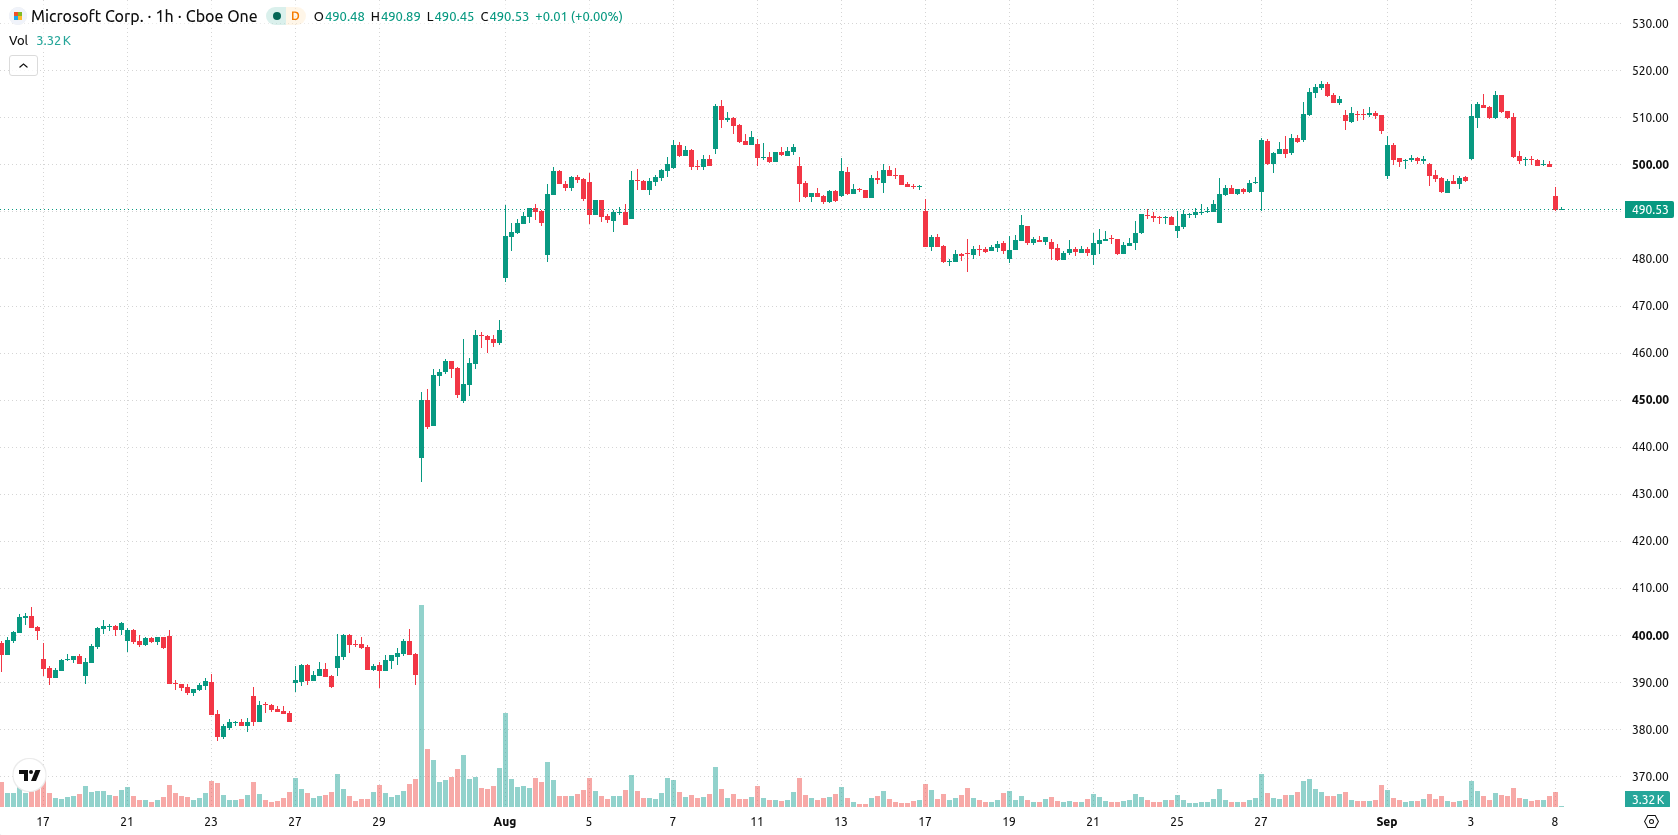
Intraday selling intensifies as multiple resistances and bearish signals align
On the hourly chart, MSFT faces resistance at the MA-20 ($503.16), MA-50 ($505.25), and the Ichimoku Kijun at $504.73. Long-term support sits at MA-200 ($430.99), with closer support levels anchored around $482.14. Momentum indicators are mixed: the MACD and ADX remain neutral, while RSI prints 42.36 (Sell). The Stochastic RSI is oversold, CCI holds neutral, and both Stochastic RSI and Bull/Bear Power confirm sellers dominate short-term momentum. The Awesome Oscillator delivers a Sell signal, reinforcing the downward pressure observed intraday.
Downside favored as high volatility narrows bullish path
Over the coming sessions, MSFT is expected to oscillate within a volatility band of $482.14 to $501.5. The probability of upward movement is assessed at 33%, while downside scenarios are more likely at 67%. The baseline scenario anticipates continued range-bound trading between support and resistance markers. A break above the Ichimoku Kijun would be required to initiate a bullish reversal, whereas sustained weakness below $482.14 would open the door to a deeper pullback.
Earlier, analysts noted that while Microsoft stock had demonstrated resilience amid challenging macroeconomic conditions, the pace of future gains would depend on the company’s ability to address capacity constraints and maintain operational efficiency. The recent widespread outages introduce a new operational risk that could pressure near-term price action, making sustained support at $482.14 a critical level for traders to monitor.






Latest Microsoft News




-
 Afghanistan
-
 Albania
-
 Algeria
-
 Angola
-
 Argentina
-
 Armenia
-
 Australia
-
 Austria
-
 Azerbaijan
-
 Bahamas
-
 Bahrain
-
 Bangladesh
-
 Belarus
-
 Belgium
-
 Bolivia
-
 Botswana
-
 Brazil
-
 Brunei
-
 Bulgaria
-
 Cambodia
-
 Cameroon
-
 Canada
-
 Chile
-
 China
-
 Colombia
-
 Congo
-
 Costa Rica
-
 Cote d'Ivoire
-
 Croatia
-
 Cuba
-
 Cyprus
-
 Czechia
-
 DR Congo
-
 Denmark
-
 Dominican Republic
-
 Ecuador
-
 Egypt
-
 El Salvador
-
 Estonia
-
 Eswatini
-
 Ethiopia
-
 Finland
-
 France
-
 Georgia
-
 Germany
-
 Ghana
-
 Greece
-
 Haiti
-
 Hong Kong
-
 Hungary
-
 India
-
 Indonesia
-
 Iran, Islamic republic
-
 Iraq
-
 Ireland
-
 Israel
-
 Italy
-
 Jamaica
-
 Japan
-
 Jordan
-
 Kazakhstan
-
 Kenya
-
 Korea
-
 Kuwait
-
 Kyrgyzstan
-
 Laos
-
 Latvia
-
 Lebanon
-
 Lesotho
-
 Libya
-
 Lithuania
-
 Luxembourg
-
 Madagascar
-
 Malaysia
-
 Malta
-
 Mauritius
-
 Mexico
-
 Moldova
-
 Mongolia
-
 Montenegro
-
 Morocco
-
 Mozambique
-
 Myanmar
-
 Namibia
-
 Nepal
-
 Netherlands
-
 New Zealand
-
 Nigeria
-
 North Macedonia
-
 Norway
-
 Oman
-
 Pakistan
-
 Palestine
-
 Panama
-
 Papua New Guinea
-
 Paraguay
-
 Peru
-
 Philippines
-
 Poland
-
 Portugal
-
 Puerto Rico
-
 Qatar
-
 Reunion
-
 Romania
-
 Rwanda
-
 Saudi Arabia
-
 Serbia
-
 Singapore
-
 Slovakia
-
 Slovenia
-
 Somalia
-
 South Africa
-
 Spain
-
 Sri Lanka
-
 Sweden
-
 Switzerland
-
 Syria
-
 Taiwan
-
 Tajikistan
-
 Tanzania
-
 Thailand
-
 Trinidad and Tobago
-
 Tunisia
-
 Turkey
-
 UAE
-
 Uganda
-
 Ukraine
-
 United Kingdom
-
United States
-
 Uruguay
-
 Uzbekistan
-
 Venezuela
-
 Vietnam
-
 Yemen
-
 Zambia
-
 Zimbabwe
- Forex
- Crypto












