

Lennar stock falls over 3% as quarterly revenue declines and institutional selling intensifies

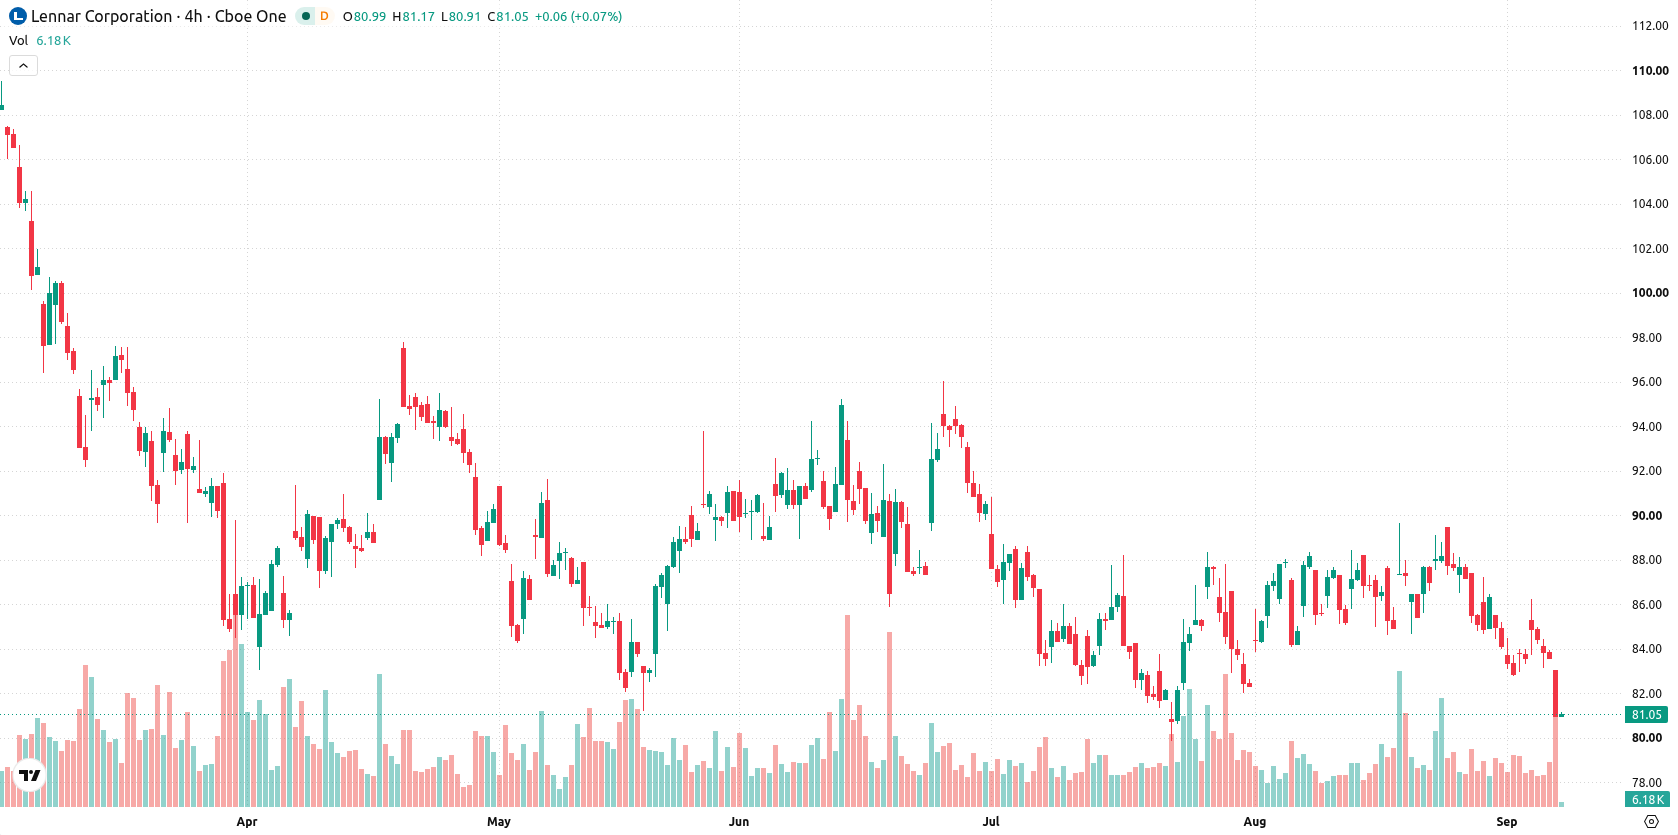
Lennar Corporation (LEN) fell 3.11% today following a 5.2% year-over-year decline in quarterly revenue and sector-wide downgrades, with additional weight from recent institutional selling. Seller pressure is reinforced by Lennar trading below its 20-day, 50-day, and 200-day moving averages, confirming a persistent bearish tone.
 88.11
88.11
Highlights
- Lennar reported quarterly revenue down 5.2% year-over-year and paid a $2.00 annualized dividend with a 31.3% payout ratio.
- Wellington Management Group cut its stake in Lennar by 13.3% to 184,844 shares, with institutional investors holding 81.1% overall.
- Lennar stock is under persistent seller pressure and expected to trade between $78.53 and $82.53, with technicals signaling high probability of continued downside.
Revenue loss and ownership cuts drive bearish institutional sentiment
Lennar reported a 5.2% decline in quarterly revenue year-over-year and paid a quarterly dividend of $2.00 annualized with a payout ratio of 31.30%. Recent sector-wide downgrades accompanied the news of Wellington Management Group LLP reducing its holdings in Lennar by 13.3% during the second quarter, now holding 184,844 shares. Institutional investors collectively own 81.1% of the company’s stock.
Persistent selling confirmed as technical levels and momentum deteriorate
Lennar is trading below its 20-day, 50-day, and 200-day moving averages ($85.85, $85.72, and $98.36, respectively), reflecting clear seller pressure across short-, medium-, and long-term trends. The nearest resistance is at $81.06, with the closest floor at $78.53. The longer-term bearish alignment is confirmed by a distant 50-day versus 200-day average. Momentum signals remain negative. The Moving Average Convergence Divergence (MACD) issues a sell signal, and the Average Directional Index (ADX) is soft, reflecting a weak or indecisive trend. The Relative Strength Index (RSI) points to a sell and does not indicate oversold conditions, but the Stochastic RSI, Commodity Channel Index (CCI), and Bull/Bear Power (BBP) all signal strong oversold or seller-dominant readings. The BBP is negative, confirming sellers are in control. The Awesome Oscillator (AO) also aligns with the bearish pressure. Price action is clustered near the daily low, with intraday volatility at 2.45%. The tone is one of persistent selling, with no notable reversal yet confirmed.
Previously it was reported that Lennar shares faced limited upside as technical resistance and a split structure kept price action contained. The current technical setup strengthens this view, with sustained bearish pressure now placing focus on the $78.53 support as the key level for downside risk in the near term.









-
 Afghanistan
-
 Albania
-
 Algeria
-
 Angola
-
 Argentina
-
 Armenia
-
 Australia
-
 Austria
-
 Azerbaijan
-
 Bahamas
-
 Bahrain
-
 Bangladesh
-
 Belarus
-
 Belgium
-
 Bolivia
-
 Botswana
-
 Brazil
-
 Brunei
-
 Bulgaria
-
 Cambodia
-
 Cameroon
-
 Canada
-
 Chile
-
 China
-
 Colombia
-
 Congo
-
 Costa Rica
-
 Cote d'Ivoire
-
 Croatia
-
 Cuba
-
 Cyprus
-
 Czechia
-
 DR Congo
-
 Denmark
-
 Dominican Republic
-
 Ecuador
-
 Egypt
-
 El Salvador
-
 Estonia
-
 Eswatini
-
 Ethiopia
-
 Finland
-
 France
-
 Georgia
-
 Germany
-
 Ghana
-
 Greece
-
 Haiti
-
 Hong Kong
-
 Hungary
-
 India
-
 Indonesia
-
 Iran, Islamic republic
-
 Iraq
-
 Ireland
-
 Israel
-
 Italy
-
 Jamaica
-
 Japan
-
 Jordan
-
 Kazakhstan
-
 Kenya
-
 Korea
-
 Kuwait
-
 Kyrgyzstan
-
 Laos
-
 Latvia
-
 Lebanon
-
 Lesotho
-
 Libya
-
 Lithuania
-
 Luxembourg
-
 Madagascar
-
 Malaysia
-
 Malta
-
 Mauritius
-
 Mexico
-
 Moldova
-
 Mongolia
-
 Montenegro
-
 Morocco
-
 Mozambique
-
 Myanmar
-
 Namibia
-
 Nepal
-
 Netherlands
-
 New Zealand
-
 Nigeria
-
 North Macedonia
-
 Norway
-
 Oman
-
 Pakistan
-
 Palestine
-
 Panama
-
 Papua New Guinea
-
 Paraguay
-
 Peru
-
 Philippines
-
 Poland
-
 Portugal
-
 Puerto Rico
-
 Qatar
-
 Reunion
-
 Romania
-
 Rwanda
-
 Saudi Arabia
-
 Serbia
-
 Singapore
-
 Slovakia
-
 Slovenia
-
 Somalia
-
 South Africa
-
 Spain
-
 Sri Lanka
-
 Sweden
-
 Switzerland
-
 Syria
-
 Taiwan
-
 Tajikistan
-
 Tanzania
-
 Thailand
-
 Trinidad and Tobago
-
 Tunisia
-
 Turkey
-
 UAE
-
 Uganda
-
 Ukraine
-
 United Kingdom
-
United States
-
 Uruguay
-
 Uzbekistan
-
 Venezuela
-
 Vietnam
-
 Yemen
-
 Zambia
-
 Zimbabwe
- Forex
- Crypto












