

Barrick Gold stock rally gains traction as uncertainty dominates the short-term trend

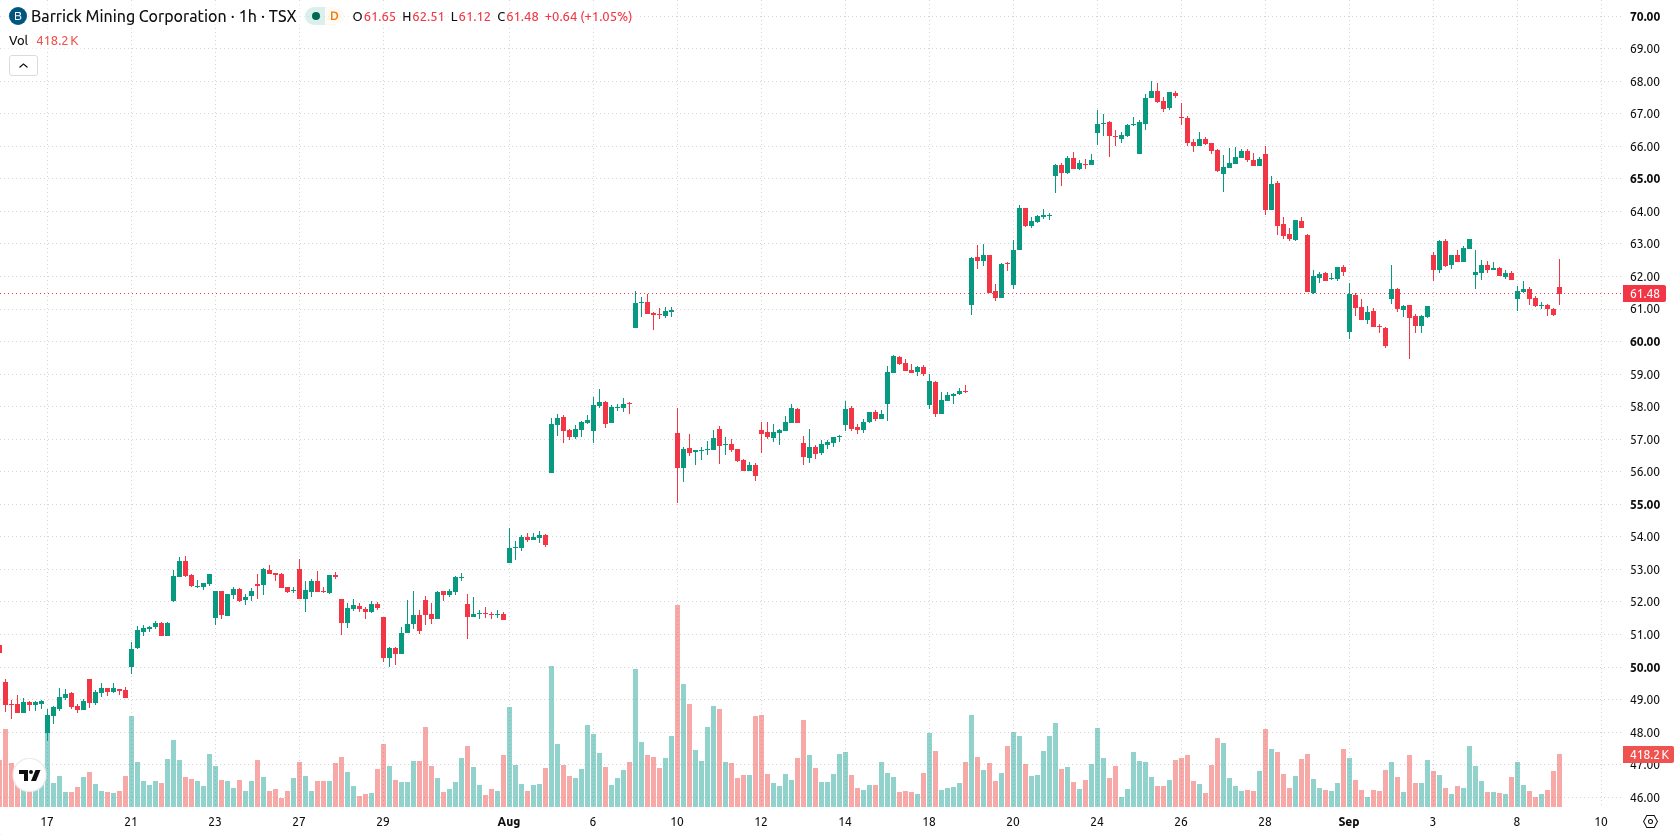
Barrick Gold (ABX) stock is trading at C$61.6, up 1.3% on the day. The price sits below its key short- and medium-term moving averages but remains above its longer-term average, reflecting a mixed near-term technical stance.
 60.46
60.46
Highlights
- ABX/CAD stock trades below key short and medium-term moving averages, showing a short-term bearish trend.
- Technical momentum indicators are mixed, with prevailing downside pressure yet intraday buyers remain active and oscillators diverge.
- Price is forecast to oscillate between C$59.83 and C$62.66 over the next several sessions, with a slightly higher probability of further downside.
Momentum signals diverge as resistance and support converge
The MA-20 and MA-50 provide nearby dynamic resistance at C$61.95 and C$61.91, while the MA-200 offers longer-term support at C$59.01. The Ichimoku Kijun line at C$61.31 currently serves as immediate support. Looking at momentum, MACD and ADX both indicate a sell bias, showing downside pressure, whereas RSI is at 52.58 and flagged 'Buy', and Stochastic RSI is in the overbought zone. The CCI and Awesome Oscillator both show neutral conditions, while Bull/Bear Power highlights dominant intraday buyer strength. The interplay between these indicators depicts a technical setup marked by uncertainty, despite pockets of buyer momentum.
Rangebound outlook prevails as volatility and support guide moves
Over the next several trading days, the price is expected to fluctuate within a band of C$59.83 to C$62.66, consistent with typical volatility for the stock. The probability of an upward move is estimated at 48%, while a further decline is slightly more likely at 52%. Most likely, ABX will continue to trade sideways within this range, unless a break above resistance opens a path toward the upper band, or a drop below support exposes downside toward the lower bound.
In a recent review, Canada's leading stock market ranking highlighted strong performance and sector diversification among top Canadian-listed companies, with major names in mining and resources receiving particular attention. Against this backdrop, Barrick Gold’s current technical setup underscores the importance of monitoring the C$61.91–C$61.95 resistance zone for signs of a potential shift in momentum.






Latest Barrick Gold News





-
 Afghanistan
-
 Albania
-
 Algeria
-
 Angola
-
 Argentina
-
 Armenia
-
 Australia
-
 Austria
-
 Azerbaijan
-
 Bahamas
-
 Bahrain
-
 Bangladesh
-
 Belarus
-
 Belgium
-
 Bolivia
-
 Botswana
-
 Brazil
-
 Brunei
-
 Bulgaria
-
 Cambodia
-
 Cameroon
-
 Canada
-
 Chile
-
 China
-
 Colombia
-
 Congo
-
 Costa Rica
-
 Cote d'Ivoire
-
 Croatia
-
 Cuba
-
 Cyprus
-
 Czechia
-
 DR Congo
-
 Denmark
-
 Dominican Republic
-
 Ecuador
-
 Egypt
-
 El Salvador
-
 Estonia
-
 Eswatini
-
 Ethiopia
-
 Finland
-
 France
-
 Georgia
-
 Germany
-
 Ghana
-
 Greece
-
 Haiti
-
 Hong Kong
-
 Hungary
-
 India
-
 Indonesia
-
 Iran, Islamic republic
-
 Iraq
-
 Ireland
-
 Israel
-
 Italy
-
 Jamaica
-
 Japan
-
 Jordan
-
 Kazakhstan
-
 Kenya
-
 Korea
-
 Kuwait
-
 Kyrgyzstan
-
 Laos
-
 Latvia
-
 Lebanon
-
 Lesotho
-
 Libya
-
 Lithuania
-
 Luxembourg
-
 Madagascar
-
 Malaysia
-
 Malta
-
 Mauritius
-
 Mexico
-
 Moldova
-
 Mongolia
-
 Montenegro
-
 Morocco
-
 Mozambique
-
 Myanmar
-
 Namibia
-
 Nepal
-
 Netherlands
-
 New Zealand
-
 Nigeria
-
 North Macedonia
-
 Norway
-
 Oman
-
 Pakistan
-
 Palestine
-
 Panama
-
 Papua New Guinea
-
 Paraguay
-
 Peru
-
 Philippines
-
 Poland
-
 Portugal
-
 Puerto Rico
-
 Qatar
-
 Reunion
-
 Romania
-
 Rwanda
-
 Saudi Arabia
-
 Serbia
-
 Singapore
-
 Slovakia
-
 Slovenia
-
 Somalia
-
 South Africa
-
 Spain
-
 Sri Lanka
-
 Sweden
-
 Switzerland
-
 Syria
-
 Taiwan
-
 Tajikistan
-
 Tanzania
-
 Thailand
-
 Trinidad and Tobago
-
 Tunisia
-
 Turkey
-
 UAE
-
 Uganda
-
 Ukraine
-
 United Kingdom
-
United States
-
 Uruguay
-
 Uzbekistan
-
 Venezuela
-
 Vietnam
-
 Yemen
-
 Zambia
-
 Zimbabwe
- Forex
- Crypto












