

LCID slides around 7.5% as management reports heavy cash flow burn and stock remains below key moving averages

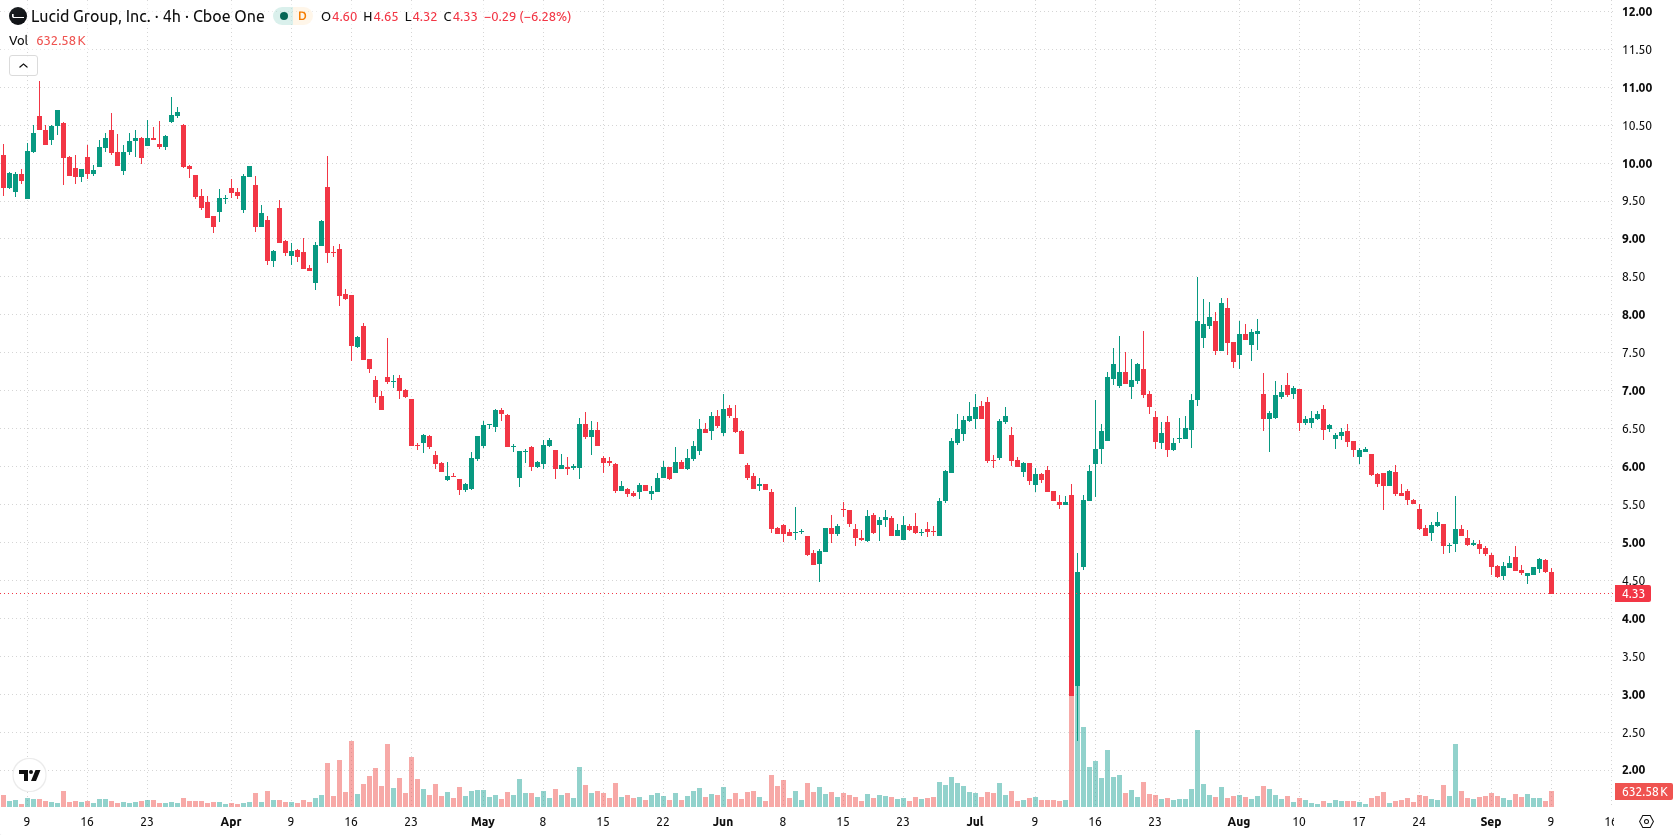
Lucid Group, Inc. (LCID) fell 7.45% after management reported a significant quarterly cash flow burn, driving renewed concern about ongoing cost pressures and financial discipline. The move is supported by sustained downside technical momentum and the stock remaining below all major moving averages.
 3.11
3.59
Highlights
- Lucid posted a free cash flow burn of $1.476 billion, paired with a 56% rise in revenue for the period.
- Management opted for targeted production cuts in order to preserve cash compared to major industry peers.
- Shares of Lucid trade below key moving averages with all tracked momentum indicators negative, and are expected to remain between $4.08 to $4.5 over the next five days.
Production cuts as cash burn reshapes peer comparisons
Lucid recorded a free cash flow burn of $1.476 billion in the latest reporting period, which accompanied a 56% increase in revenue. Management has implemented deliberate production cuts to help preserve cash reserves. These operational decisions occurred as the company compared its recent performance against key industry peers.
Sustained bearish pressure as sellers control technical momentum
Lucid Group is trading below its 20-day ($5.42), 50-day ($6.17), and 200-day ($8.43) moving averages, signaling ongoing pressure from sellers across all major timeframes. The long-term alignment between the 50- and 200-day averages is bearish, with near-term technical parameters framed by a ceiling at $4.4 and a floor at $4.08. Momentum indicators are decisively negative. Both the Moving Average Convergence Divergence (MACD) and Average Directional Index (ADX) signal selling pressure. The Relative Strength Index (RSI) is at 34.23 and the Commodity Channel Index (CCI) at -85.86, pointing toward oversold territory, while the Stochastic RSI is neutral. Bull/Bear Power (BBP) is negative, confirming sellers are dominating intraday momentum. The Awesome Oscillator (AO) also aligns with ongoing downside. The stock last traded at $4.29, down 7.45% for the session after an upside gap of $0.01, or about 0.22%. Price is holding near the session low with intraday volatility at 5.45%. Overall, the intraday tone remains heavy with sustained pressure after the open, which aligns with the momentum readings.
Previously it was reported that Lucid Group continued to exhibit persistent bearish momentum and heightened downside risk due to ongoing technical weakness and operational challenges. The current analysis further strengthens this outlook, highlighting increased cash flow pressures and negative momentum, with traders advised to monitor the $4.08 support as a key level for potential accelerated downside.










-
 Afghanistan
-
 Albania
-
 Algeria
-
 Angola
-
 Argentina
-
 Armenia
-
 Australia
-
 Austria
-
 Azerbaijan
-
 Bahamas
-
 Bahrain
-
 Bangladesh
-
 Belarus
-
 Belgium
-
 Bolivia
-
 Botswana
-
 Brazil
-
 Brunei
-
 Bulgaria
-
 Cambodia
-
 Cameroon
-
 Canada
-
 Chile
-
 China
-
 Colombia
-
 Congo
-
 Costa Rica
-
 Cote d'Ivoire
-
 Croatia
-
 Cuba
-
 Cyprus
-
 Czechia
-
 DR Congo
-
 Denmark
-
 Dominican Republic
-
 Ecuador
-
 Egypt
-
 El Salvador
-
 Estonia
-
 Eswatini
-
 Ethiopia
-
 Finland
-
 France
-
 Georgia
-
 Germany
-
 Ghana
-
 Greece
-
 Haiti
-
 Hong Kong
-
 Hungary
-
 India
-
 Indonesia
-
 Iran, Islamic republic
-
 Iraq
-
 Ireland
-
 Israel
-
 Italy
-
 Jamaica
-
 Japan
-
 Jordan
-
 Kazakhstan
-
 Kenya
-
 Korea
-
 Kuwait
-
 Kyrgyzstan
-
 Laos
-
 Latvia
-
 Lebanon
-
 Lesotho
-
 Libya
-
 Lithuania
-
 Luxembourg
-
 Madagascar
-
 Malaysia
-
 Malta
-
 Mauritius
-
 Mexico
-
 Moldova
-
 Mongolia
-
 Montenegro
-
 Morocco
-
 Mozambique
-
 Myanmar
-
 Namibia
-
 Nepal
-
 Netherlands
-
 New Zealand
-
 Nigeria
-
 North Macedonia
-
 Norway
-
 Oman
-
 Pakistan
-
 Palestine
-
 Panama
-
 Papua New Guinea
-
 Paraguay
-
 Peru
-
 Philippines
-
 Poland
-
 Portugal
-
 Puerto Rico
-
 Qatar
-
 Reunion
-
 Romania
-
 Rwanda
-
 Saudi Arabia
-
 Serbia
-
 Singapore
-
 Slovakia
-
 Slovenia
-
 Somalia
-
 South Africa
-
 Spain
-
 Sri Lanka
-
 Sweden
-
 Switzerland
-
 Syria
-
 Taiwan
-
 Tajikistan
-
 Tanzania
-
 Thailand
-
 Trinidad and Tobago
-
 Tunisia
-
 Turkey
-
 UAE
-
 Uganda
-
 Ukraine
-
 United Kingdom
-
United States
-
 Uruguay
-
 Uzbekistan
-
 Venezuela
-
 Vietnam
-
 Yemen
-
 Zambia
-
 Zimbabwe
- Forex
- Crypto












