

TPR slides over 3% as sellers dominate and Tapestry trades below key moving averages

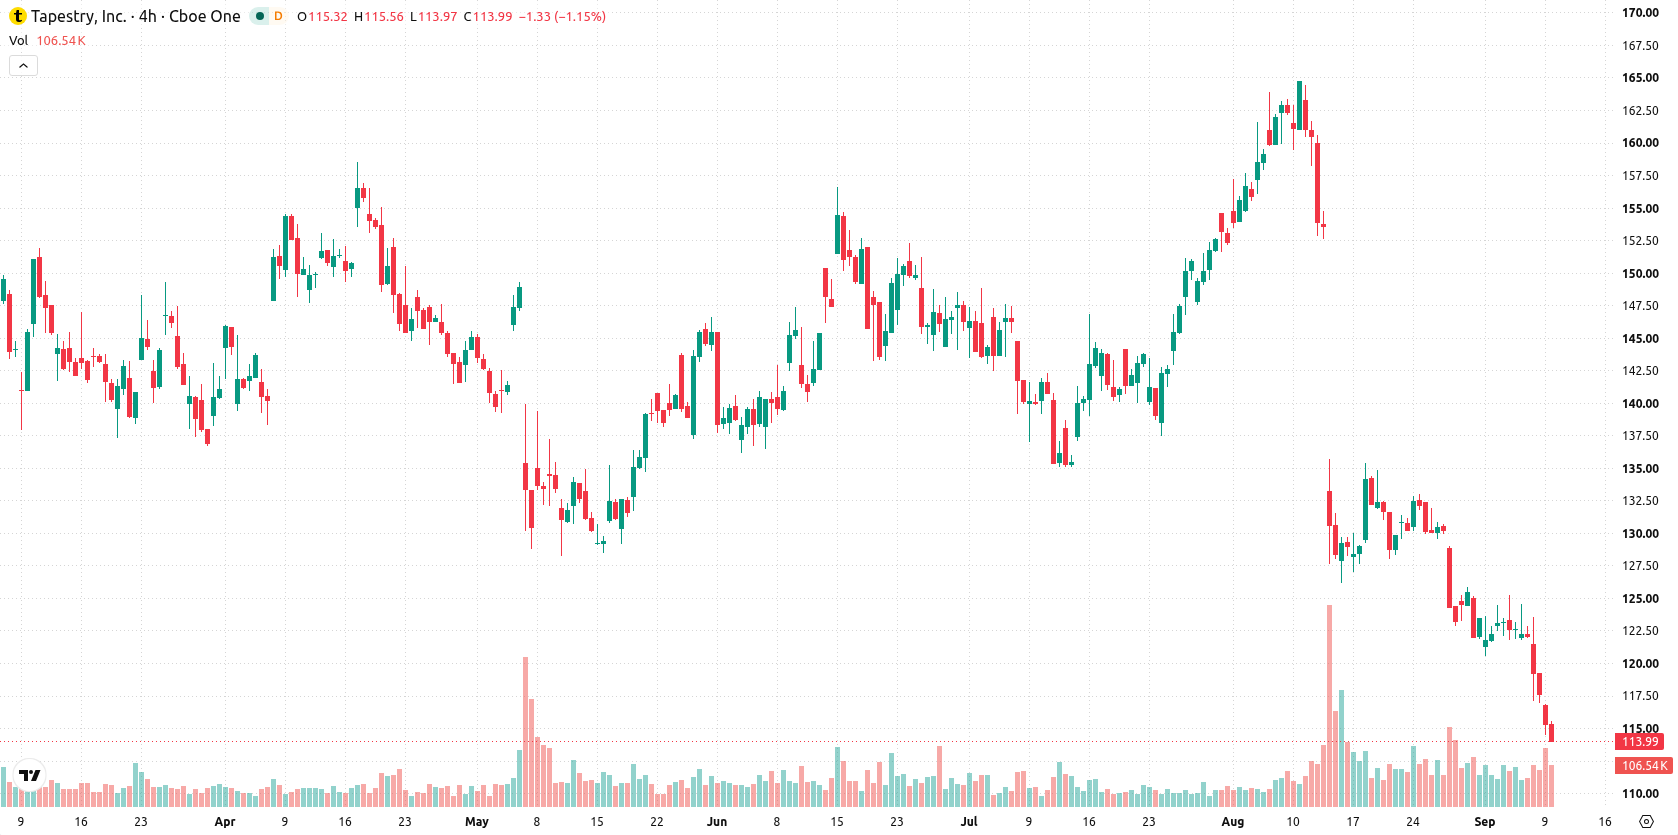
Tapestry Inc (TPR) fell 3.26% after technical selling intensified, even as the company increased its quarterly dividend and maintained guidance. The move is reinforced by persistent downside momentum, with TPR trading below all key moving averages and sellers dominating across trend indicators.
 119.80
Highlights
- Tapestry raised its quarterly dividend by 16% to $0.4625 per share, annualizing at $1.85 per share.
- The company projects fiscal 2027 revenue of $8.4 billion to $8.5 billion and adjusted EPS of $7.80 to $7.90.
- Tapestry stock remains under selling pressure with negative momentum and is expected to trade between $109.89 and $117.55 over the next five sessions.
Dividend hike and buybacks fail to offset sustained broad selling pressure
Tapestry approved a 16% increase in its quarterly dividend to $0.4625 per share, bringing the annualized payout to $1.85 per share. The company projected fiscal 2027 revenue between $8.4 billion and $8.5 billion and adjusted EPS in the range of $7.80 to $7.90. Financial flexibility was maintained through modest leverage and ongoing share buybacks, though price action has remained under broader selling pressure.
Oversold signals emerge as long- and short-term weakness persists
Tapestry is trading below its 20-day, 50-day, and 200-day moving averages ($129.84, $140.2, and $138.42), highlighting sustained downside momentum in short-, medium-, and long-term trends. Resistance sits at $114.61 and support at $109.89, with overhead levels confirming persistent selling pressure, even as a long-term bullish alignment remains between the 50-day and 200-day averages. Momentum is negative with both the MACD and ADX pointing to continued selling. RSI, Stochastic RSI, and CCI all signal oversold conditions, suggesting downside exhaustion could be forming. Sellers dominate the Bull/Bear Power indicator, reinforcing weakness, while the Awesome Oscillator is neutral. Tapestry lost $3.83, slipping 3.26% on the session. Intraday volatility measured 2.57%, and the session closed near lows as sellers maintained control.
Earlier, analysts noted that Tapestry continued to face persistent downside risk despite positive corporate developments and institutional investment. The current analysis strengthens this view, with new technical signals reinforcing sustained selling pressure and positioning the $109.89 support level as a critical pivot for short-term traders.






Latest Tapestry Inc News



-
 Afghanistan
-
 Albania
-
 Algeria
-
 Angola
-
 Argentina
-
 Armenia
-
 Australia
-
 Austria
-
 Azerbaijan
-
 Bahamas
-
 Bahrain
-
 Bangladesh
-
 Belarus
-
 Belgium
-
 Bolivia
-
 Botswana
-
 Brazil
-
 Brunei
-
 Bulgaria
-
 Cambodia
-
 Cameroon
-
 Canada
-
 Chile
-
 China
-
 Colombia
-
 Congo
-
 Costa Rica
-
 Cote d'Ivoire
-
 Croatia
-
 Cuba
-
 Cyprus
-
 Czechia
-
 DR Congo
-
 Denmark
-
 Dominican Republic
-
 Ecuador
-
 Egypt
-
 El Salvador
-
 Estonia
-
 Eswatini
-
 Ethiopia
-
 Finland
-
 France
-
 Georgia
-
 Germany
-
 Ghana
-
 Greece
-
 Haiti
-
 Hong Kong
-
 Hungary
-
 India
-
 Indonesia
-
 Iran, Islamic republic
-
 Iraq
-
 Ireland
-
 Israel
-
 Italy
-
 Jamaica
-
 Japan
-
 Jordan
-
 Kazakhstan
-
 Kenya
-
 Korea
-
 Kuwait
-
 Kyrgyzstan
-
 Laos
-
 Latvia
-
 Lebanon
-
 Lesotho
-
 Libya
-
 Lithuania
-
 Luxembourg
-
 Madagascar
-
 Malaysia
-
 Malta
-
 Mauritius
-
 Mexico
-
 Moldova
-
 Mongolia
-
 Montenegro
-
 Morocco
-
 Mozambique
-
 Myanmar
-
 Namibia
-
 Nepal
-
 Netherlands
-
 New Zealand
-
 Nigeria
-
 North Macedonia
-
 Norway
-
 Oman
-
 Pakistan
-
 Palestine
-
 Panama
-
 Papua New Guinea
-
 Paraguay
-
 Peru
-
 Philippines
-
 Poland
-
 Portugal
-
 Puerto Rico
-
 Qatar
-
 Reunion
-
 Romania
-
 Rwanda
-
 Saudi Arabia
-
 Serbia
-
 Singapore
-
 Slovakia
-
 Slovenia
-
 Somalia
-
 South Africa
-
 Spain
-
 Sri Lanka
-
 Sweden
-
 Switzerland
-
 Syria
-
 Taiwan
-
 Tajikistan
-
 Tanzania
-
 Thailand
-
 Trinidad and Tobago
-
 Tunisia
-
 Turkey
-
 UAE
-
 Uganda
-
 Ukraine
-
 United Kingdom
-
United States
-
 Uruguay
-
 Uzbekistan
-
 Venezuela
-
 Vietnam
-
 Yemen
-
 Zambia
-
 Zimbabwe
- Forex
- Crypto












