

Tapestry stock gains more than 5% after investors position ahead of earnings report

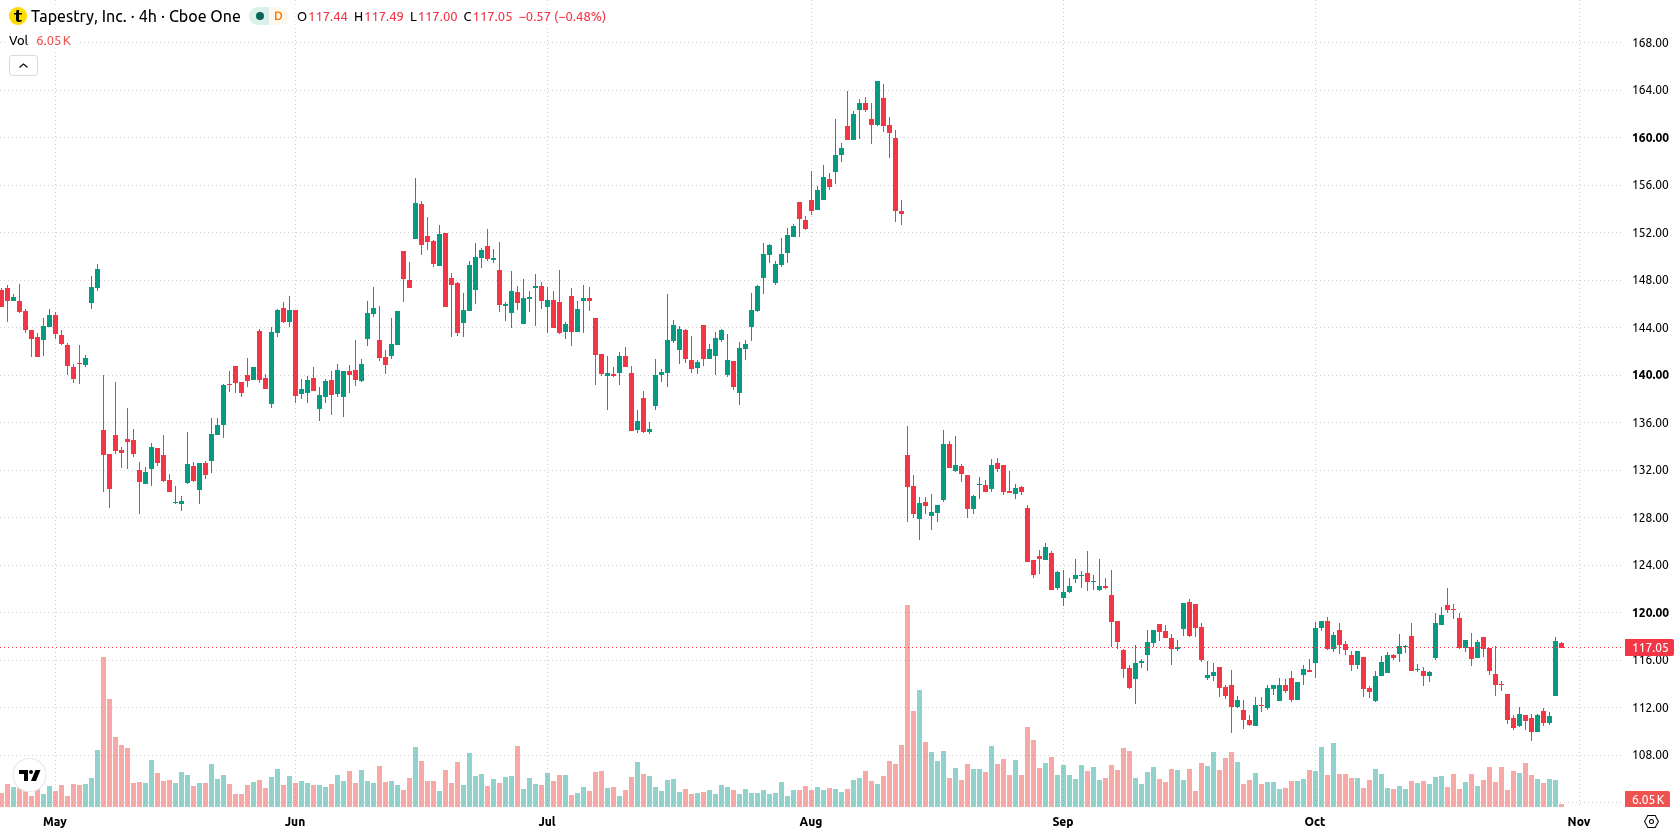
Tapestry Inc (TPR) advanced 5.09% today ahead of its scheduled Q1 2027 earnings release, attracting buyers on anticipation of fresh financial results. The move looks limited, with TPR trading above its 20-day average but still constrained by a medium- and long-term bearish technical setup.
 120.82
Highlights
- Tapestry will announce its Q1 2027 results before the market opens on November 5.
- Smith Group Asset Management LLC reduced its position in Tapestry, selling more than a third of its shares.
- Tapestry stock trades in a near-term range of $115.33 to $122.97 with technical indicators signaling strong seller control and increased downside probability.
Shareholder exit contrasts with history of earnings surprises
Tapestry is set to release its Q1 2027 earnings before the market opens on November 5. Smith Group Asset Management LLC recently reduced its stake in the company by selling more than a third of its shares. The company also has a record of strong earnings surprises.
Medium-term resistance holds as sellers dominate momentum indicators
Tapestry is trading above its 20-day moving average ($115.59) but remains below the 50-day ($118.25) and 200-day ($137.36) averages, indicating short-term upside inside a medium- and long-term bearish structure. The nearest support is $115.59, with resistance at the session high of $116.91. The alignment of the 50-day and 200-day moving averages confirms the prevailing bearish trend over the longer term. Momentum indicators are weak: MACD and ADX signal a sell bias and the RSI at 38.2 indicates a bearish tilt. Oscillators, including Stochastic RSI (13.06), CCI (-127.39), and Bull/Bear Power (-2.06), reflect oversold conditions and persistent seller control intraday. The Awesome Oscillator remains negative, further reinforcing the downtrend. Despite today's $5.66 gain and an upside gap at the open, indicator readings suggest continued selling pressure and potential exhaustion as short-term momentum struggles to turn upbeat.
Earlier, analysts noted that Tapestry shifted into an uptrend as improved brand positioning and short-term technical strength drew renewed investor attention. The current analysis, however, signals a reversal to a primarily bearish technical outlook, with traders now monitoring $116.91 as the key inflection point for any potential recovery.






Latest Tapestry Inc News



-
 Afghanistan
-
 Albania
-
 Algeria
-
 Angola
-
 Argentina
-
 Armenia
-
 Australia
-
 Austria
-
 Azerbaijan
-
 Bahamas
-
 Bahrain
-
 Bangladesh
-
 Belarus
-
 Belgium
-
 Bolivia
-
 Botswana
-
 Brazil
-
 Brunei
-
 Bulgaria
-
 Cambodia
-
 Cameroon
-
 Canada
-
 Chile
-
 China
-
 Colombia
-
 Congo
-
 Costa Rica
-
 Cote d'Ivoire
-
 Croatia
-
 Cuba
-
 Cyprus
-
 Czechia
-
 DR Congo
-
 Denmark
-
 Dominican Republic
-
 Ecuador
-
 Egypt
-
 El Salvador
-
 Estonia
-
 Eswatini
-
 Ethiopia
-
 Finland
-
 France
-
 Georgia
-
 Germany
-
 Ghana
-
 Greece
-
 Haiti
-
 Hong Kong
-
 Hungary
-
 India
-
 Indonesia
-
 Iran, Islamic republic
-
 Iraq
-
 Ireland
-
 Israel
-
 Italy
-
 Jamaica
-
 Japan
-
 Jordan
-
 Kazakhstan
-
 Kenya
-
 Korea
-
 Kuwait
-
 Kyrgyzstan
-
 Laos
-
 Latvia
-
 Lebanon
-
 Lesotho
-
 Libya
-
 Lithuania
-
 Luxembourg
-
 Madagascar
-
 Malaysia
-
 Malta
-
 Mauritius
-
 Mexico
-
 Moldova
-
 Mongolia
-
 Montenegro
-
 Morocco
-
 Mozambique
-
 Myanmar
-
 Namibia
-
 Nepal
-
 Netherlands
-
 New Zealand
-
 Nigeria
-
 North Macedonia
-
 Norway
-
 Oman
-
 Pakistan
-
 Palestine
-
 Panama
-
 Papua New Guinea
-
 Paraguay
-
 Peru
-
 Philippines
-
 Poland
-
 Portugal
-
 Puerto Rico
-
 Qatar
-
 Reunion
-
 Romania
-
 Rwanda
-
 Saudi Arabia
-
 Serbia
-
 Singapore
-
 Slovakia
-
 Slovenia
-
 Somalia
-
 South Africa
-
 Spain
-
 Sri Lanka
-
 Sweden
-
 Switzerland
-
 Syria
-
 Taiwan
-
 Tajikistan
-
 Tanzania
-
 Thailand
-
 Trinidad and Tobago
-
 Tunisia
-
 Turkey
-
 UAE
-
 Uganda
-
 Ukraine
-
 United Kingdom
-
United States
-
 Uruguay
-
 Uzbekistan
-
 Venezuela
-
 Vietnam
-
 Yemen
-
 Zambia
-
 Zimbabwe
- Forex
- Crypto












